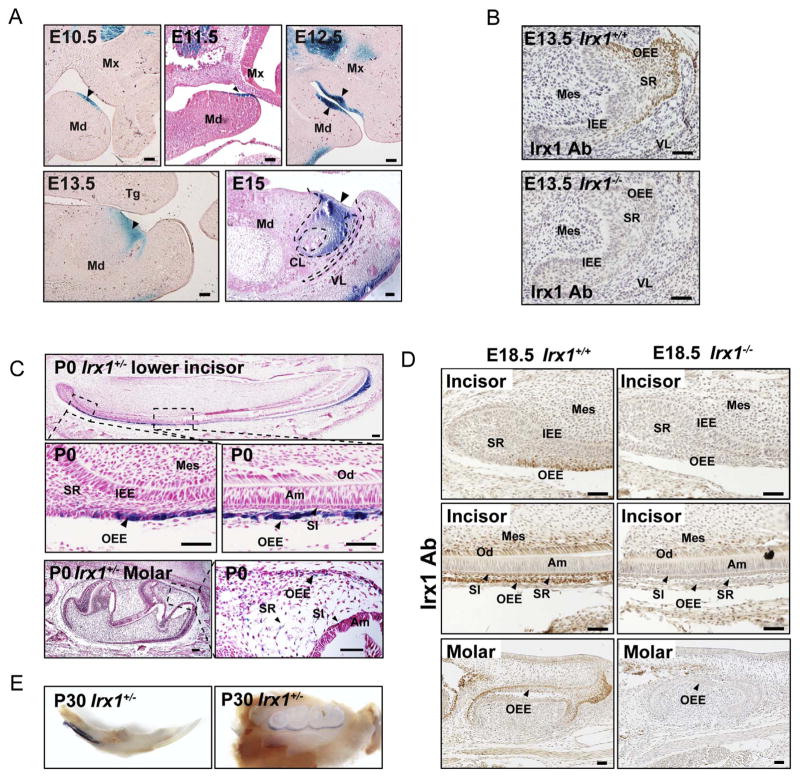
Fig. 3. Expression pattern of Irx1 in teeth.
(A) Representative images show X-gal and eosin staining of sections from different stages of Irx1+/− embryos. The teeth from E10.5 to E12.5 were stained entirely with X-gal. At the cap stage (E13.5, E15), X-gal positive signals are limited to areas adjacent to oral cavity. (B) Representative images showing immunostaining of Irx1 in E13.5 lower incisor in Irx1+/+ and Irx1−/− embryos. SR, stratum reticular; IEE, inner enamel epithelium; OEE, outer enamel epithelium; VL, vestibular lamina; Mes, mesenchyme. (C) Representative images of X-gal and nuclear fast red staining in P0 stage lower incisors and molars in Irx1+/− mice. X-gal positive signals are limited to OEE, SR, and SI cells. SI, stratum intermedium; SR, stratum reticular; IEE, inner enamel epithelium; OEE, outer enamel epithelium; Am, ameloblasts; Od, odontoblasts; Mes, mesenchyme. (D) Representative images show immunostaining of Irx1 in lower incisors and molars in E18.5 stage Irx1+/+ and Irx1−/− mice. (E) Images ages show X-gal staining of lower incisor and molars in 30 days old Irx1+/− mouse. Scale bar in this figure: 50 μm.

