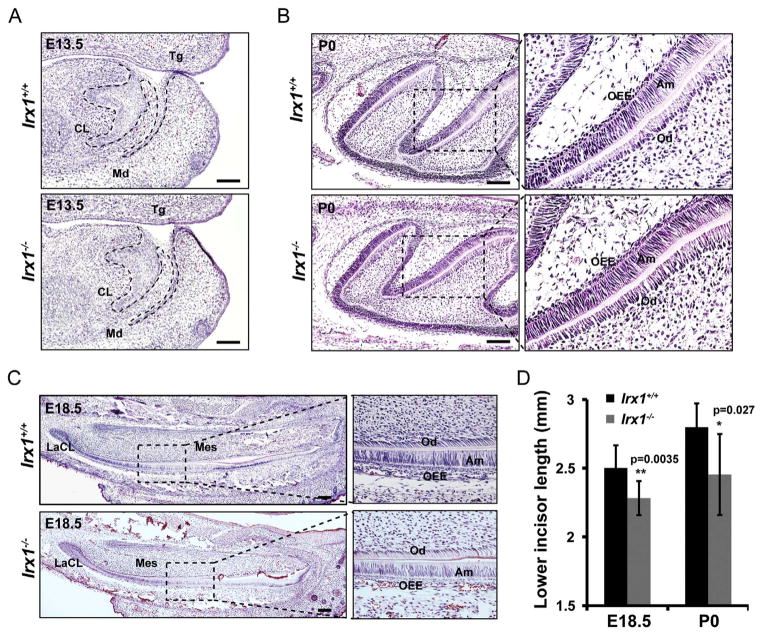
Fig. 6. Tooth growth is reduced in Irx1−/− embryos.
(A) Representative images of hematoxylin & eosin staining in E13.5 lower incisors. The invagination of dental development is delayed in Irx1−/− lower incisors. CL, cervical loop; Tg, tongue; Md, mandible. (B, C) Representative images of hematoxylin & eosin staining in molars (P0) and lower incisors (E18.5) in Irx1+/+ and Irx1−/− mice. OEE, outer enamel epithelium; Am, ameloblasts; Od, odontoblasts; Mes, mesenchyme; LaCL, labial cervical loop. (D) Bar chart shows statistical analysis of lower incisor length in E18.5 and P0 Irx1+/+ and Irx1−/− mice. Lower incisors in Irx1−/− are shorter respectively. Mean ± s.e.m; N = 6, p values are shown in bar chart. Scale bar: 100 μm.

