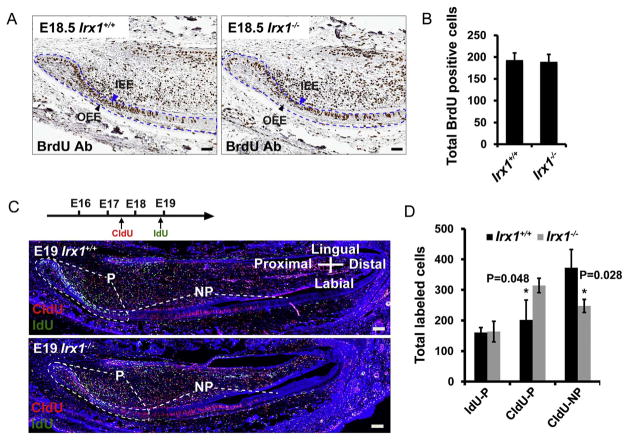
Fig. 7. Epithelial cell differentiation is decreased in Irx1−/− mice.
(A) BrdU immunohistochemistry staining of E18.5 lower incisors. BrdU was injected into pregnant female 2 h before harvesting. Representative images show dental epithelial cells (dashed outline) at the cervical loop region marked with BrdU signals. Blue arrows show that IEE cells are labeled with BrdU signals; black arrows show that OEE cells are not labeled with BrdU signals. (B) Bar chart shows total cell number of BrdU positive cells in the dashed outline region. (C) CIdU and IdU double immunofluorescence staining at E19. CIdU (36 h pre-harvest) and IdU (2 h pre-harvest) were injected into pregnant female before harvesting at E19 (see diagram). Dashed lines show the proliferation zone of dental epithelial layers including the labial cervical loop of the lower incisors (P). Images were generated by Zeiss 700 with multiple horizons. Notice there is horizon shift in images. (D) Bar chart shows total IdU or CIdU positive cell number in different regions of the dental epithelial cell layers. IdU-P, IdU positive cells of the labial cervical loop and transient amplifying cells; CIdU-P, CIdU positive cells of the labial cervical loop and transient amplifying cells; CIdU-NP, CIdU positive cells of the dental epithelial cells outside of the labial cervical loop. Scale bar: 100 μm; n = 3; *, p < 0.05. (For interpretation of the references to color in this figure legend, the reader is referred to the web version of this article).

