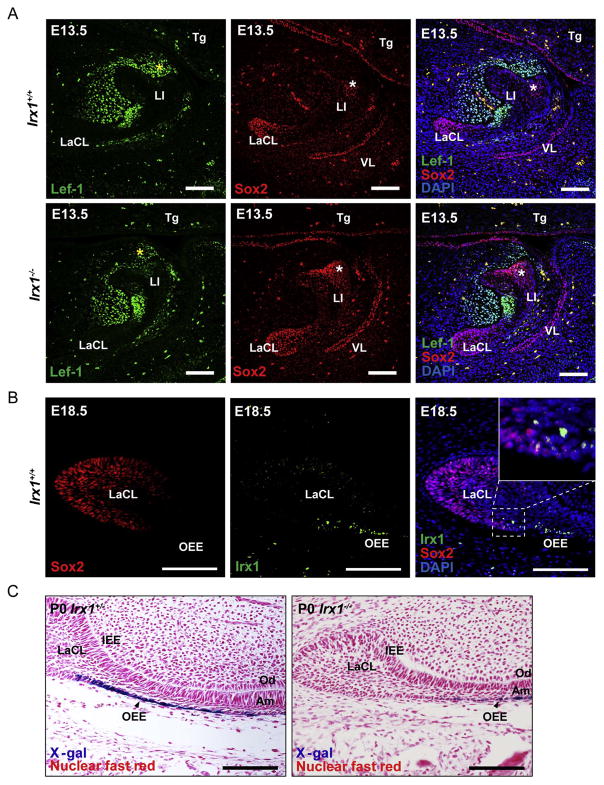
Fig. 8. Irx1 regulates the number and partitioning of Lef-1+ and Sox2+ cells during incisor development.
(A) Double immunofluorescence staining of Sox2 and Lef1 in cap stage lower incisors. Sox2 positive cell distribution is altered in Irx1−/− lower incisors. Yellow asterisks show Lef-1 expression in lingual dental mesenchyme; white asterisks show Irx1 expression within Sox2+ cells. LI, lower incisor; LaCL, labial cervical loop; VL, vestibular lamina (B) Double immunofluorescence staining shows Irx1 and Sox2 are differentially expressed in the dental epithelium of the lower incisor. Enlarged panel shows few cells co-expressing both Irx1 and Sox2. (C) X-gal & nuclear fast red staining of lower incisors from P0 Irx1+/+ and Irx1−/− mice. Representative images show there are less OEE (X-gal positive) cells of Irx1−/− lower incisor. OEE, outer enamel epithelium; CL, cervical loop; IEE, inner enamel epithelium; OD, odontoblasts; Am, ameloblasts; Tg tongue. Scale bar: 100 μm. (For interpretation of the references to color in this figure legend, the reader is referred to the web version of this article).

