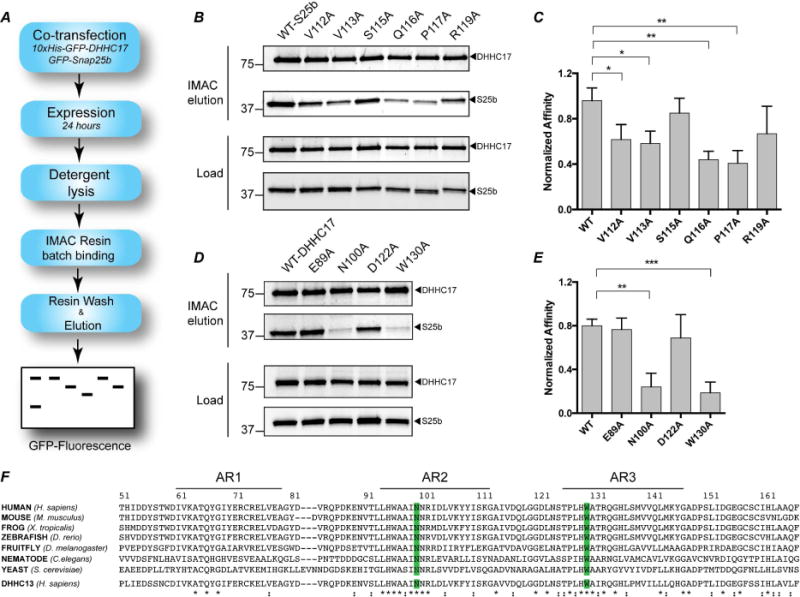
Figure 4. Pull-down assay to determine affinity of DHHC17 to Snap25b and effect of single-point mutations.

(A) Schematic depiction of the assay (B) 10xHis-GFP-DHHC17 and GFP-Snap25b-WT or mutants after 24 hours co-transfection in HEK-293T cells. Load: expression levels of each protein after lysis but prior to affinity purification. Co2+ affinity pull down: protein eluted from affinity resin after incubation for 16 hours and extensive washing. (C) Quantitation of the experiment in (B) after gel-densitometry analysis. The intensity of the band corresponding to Snap25b was divided the intensity of the corresponding DHHC17 band. Histograms represent average ± standard deviation (SD). One-way ANOVA with Dunnett’s multiple comparison test was used to compare mutants with WT (n.s., p ≥ 0.05, *p < 0.05, **p < 0.01, ***p < 0.001). (D) and (E) Same as in (B) and (C), except that mutants of DHHC17 were used to pull-down Snap25b-WT. (F) Alignment of the first three ankyrin repeats of DHHC17 in different organisms and Human DHHC13. The conserved N100 and W130 residues are highlighted in blue. Sequence alignment was preformed using Clustal-omega (Sievers et al., 2011).
