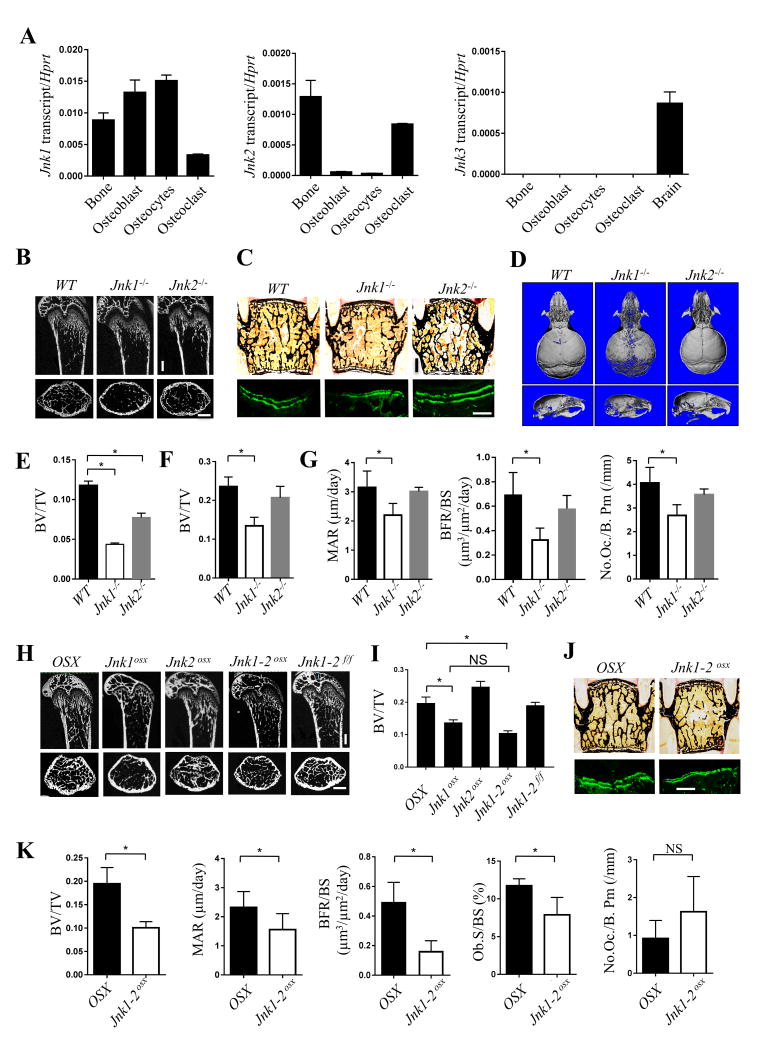
Figure 1. Jnk1 -/- and Jnk1/2osx mice have low bone mass due to decreased bone formation.
(A) Expression analysis of Jnk1, 2, and 3 (n=4). (B-G) Micro computed tomography analysis (micro-CT) analysis of the trabecular bone in the femur (B and E) and skull (D) and histological (C, upper and F) and histomorphometric (C, lower and G) analysis of the L3 vertebrae in male Jnk1-/- and Jnk2-/- mice at 6-weeks of age (male, n≥6). (H-K) Skeletal analysis of Jnk1osx, Jnk2osx, and Jnk1/2osx mice. Micro-CT analysis of the trabecular bone in the femur (H and I) and histological (J, upper) and histomorphometric (J, lower and K) analysis of the L3 vertebrae of male Jnk1osx, Jnk2osx, and Jnk1/2osx mice in 6-week-old mice (male, n≥6). Bone volume/tissue volume (BV/TV, mineral apposition rate (MAR, μm day-1), bone formation rate/bone surface (BFR/BS, μm3 μm-2 day-1), osteoclast number/bone perimeter (No. Oc./B. Pm) and osteoblast surface/bone surface (Ob.S/BS). Scale bars, 500μm. Error bars, mean ± standard deviation (s.d.) *P < 0.05.

