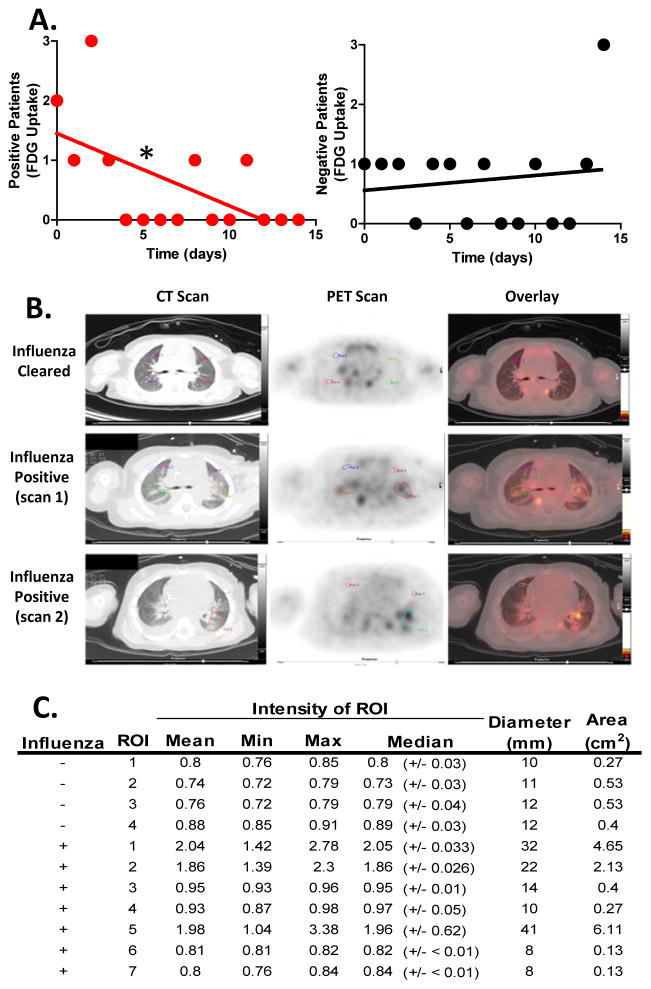
Figure 1. Glucose uptake in pediatric patients infected with respiratory viral infections.
(A–C) Patients with normal blood glucose were given 5.5 MBq/kg FDG intravenously after fasting ≥4 hours followed by 1 hr inactivity and image capture with transmission CT and PET obtained from the top of the skull to the feet. (A) We identified 20 respiratory virus-PCR positive pediatric patients retrospectively who received positron emission tomography (PET) scans. Linear regression compared the slopes of the PCR positive or negative patients over time to zero with the slope of the PCR positive line showing significant deviation from zero (P=0.0189). Significant relationship between FDG uptake and time of clinical PCR diagnosis with respiratory viral infection was found in these patients by Spearman’s correlation (rs = −0.59, number of XY pairs = 15, p =0 .0221). (B) Patient 10, a 4-year-old female tested PCR positive and underwent CT/PET scanning 3 days post infection diagnosis and 2 months later (Influenza Cleared). (C) Standardized uptake values of FDG were determined by placing regions-of-interest over areas of normal and abnormal uptake in the lungs for densitometry analysis. The mean, minimum, maximum and median densities are indicated with the ROI size (i.e. diameter and area). Where influenza negative ROI 1–4 are from the influenza cleared lungs 2 months post initial diagnosis, influenza positive 1–4 and 5–7 are from scans 1 and 2 respectively of patient 10 three days post PCR positive diagnosis for influenza A. 5 The Mann–Whitney U test was used to determine significance (i.e. p-values for mean = 0.037 and median = 0.03) with n=20. See also Figure S1 and Tables S1 & 2.

