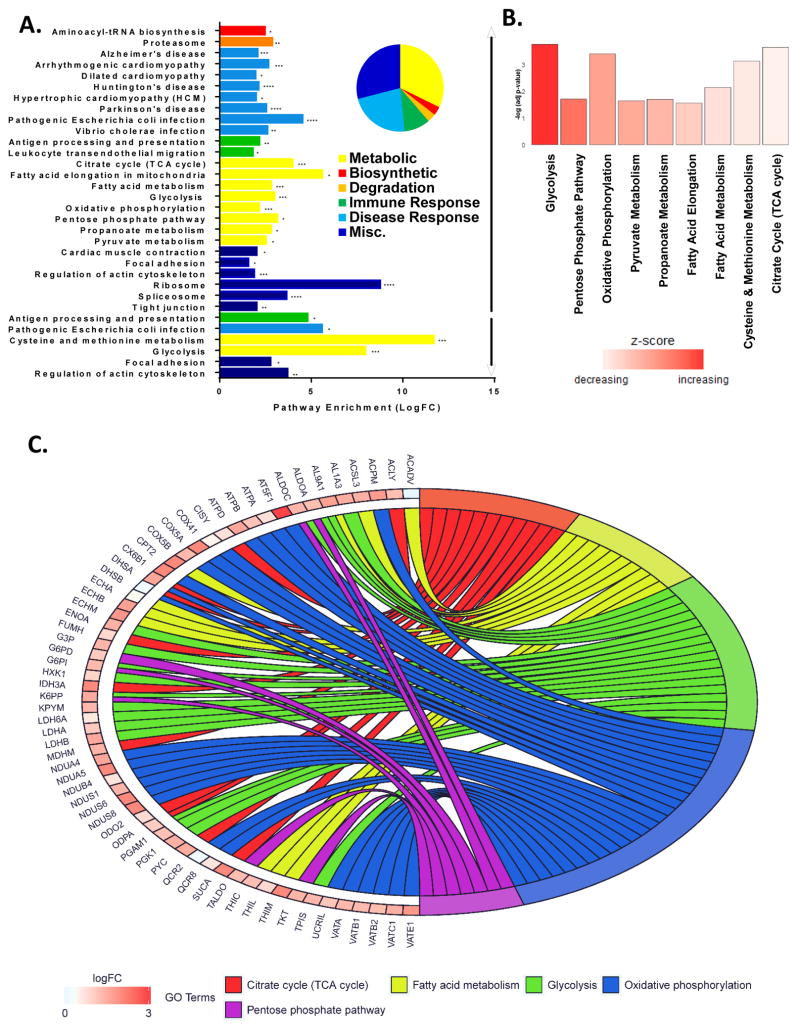
Figure 2. Metabolic pathways dominate host-cell changes after influenza virus infection.
(A–C) NHBE from one donor were expanded for 10 days and monolayers were infected with CA04 (MOI 1 pfu for 17 hours) in two separate experiments. Lysates were collected on ice, homogenized in ammonium bicarbonate and separated into soluble and insoluble fractions), iTRAQ-labeled, FASP digested, desalted with C18 SPE, and analyzed with a Velos Orbitrap mass spectrometer. All confidently identified peptides with 2-fold or greater abundance changes were input into DAVID for enrichment analysis (using Human background). (A) Significantly enriched Kyoto Encyclopedia of Genes and Genomes (KEGG) pathways are grouped by biological category (i.e. biosynthetic, degradative, disease and immune response, metabolic or misc.), and enumerated by fold enrichment. All significantly enriched KEGG pathways from the up regulated (↑) and down regulated (↓) soluble and insoluble peptides are colored by biological categories corresponding to the pie chart with fold enrichment significance is indicated with asterisk (* ≤0.05, ** ≤0.001, and *** ≤0.0001). (B) KEGG pathways within the metabolic category are graphed by the negative log of their respective p-values and bars are colored by their corresponding Z score. (C) Pathways of the metabolic biological category are colored as follows: Citric Acids Cycle (red), Fatty Acid Metabolism (yellow), Glycolysis (green), Oxidative Phosphorylation (blue), and Pentose Phosphate Pathway (purple). Proteins are labeled with their corresponding gene symbol, chords link each protein to its respective pathway(s) with the fold change (Log2) indicated by increasing red color intensity. See also Figure S2 and Table S3.

