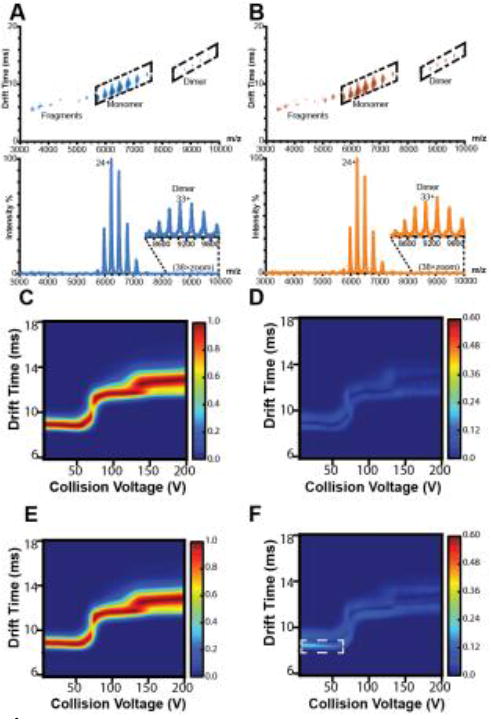
Figure 1. Ion-mobility mass spectrometry of Remicade and Remsima.

Representative IM-MS spectra of A, RC and B, RS with annotated fragment, monomer, and dimer species. Average collision induced unfolding (CIU) fingerprint of C, RC and E, RS and standard deviations of D, RC and F, RS CIU fingerprints (n = 4 lots).
