
Figure 2. Intact mass analysis of IdeS digests of Remicade and Remsima.
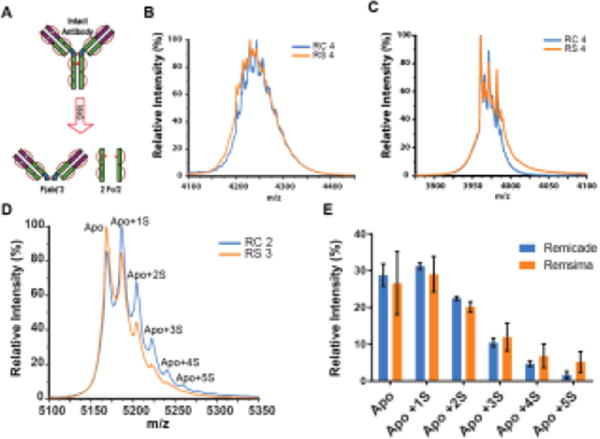
A, Schematic for IdeS enzyme cleavage. Representative intact mass spectra of the 12+ charge state of Fc regions for RC lot#4 and RS lot#4 B, before and C, after deglycosylation. D, representative mass spectra of the 19+ charge state of Fab region of RC lot # 2 and RS lot # 3 resolved peaks of the Apo or unmodified and several sugar-modified variants: Apo+1S, to Apo+5S, corresponding number of glycations). E, Glycation on Fab region of RC and RS (n = 3 lots per product, mean ± SEM).