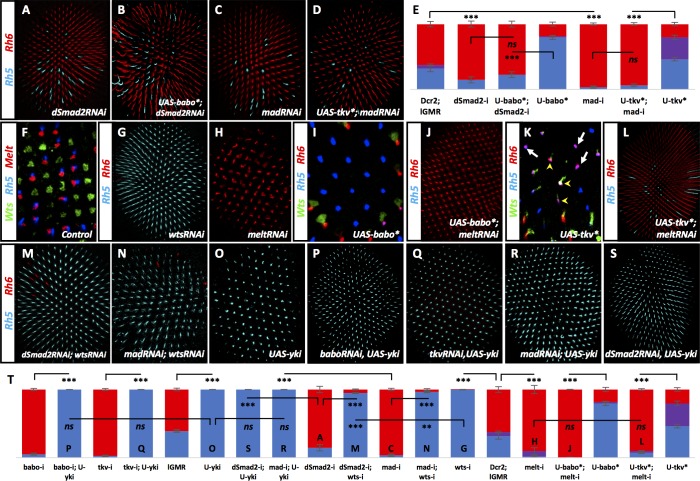
Figure 4. Babo, through dSmad2 and Tkv, through Mad, regulate Wts and Melt.
Graph Legend: Red is the percentage of R8 photoreceptors that expressed Rh6, Blue is the percentage that expressed Rh5 and Purple is Co-expression of Rh5 +Rh6. Error bars report standard error of the mean. Paired t-tests were performed against percentages of Rh5 expression and significance is denoted where applicable (***=p ≤ 0.01, **=p ≤ 0.05, ns = not significant). Where significance (or non-significance) is noted, follow the horizontal bar above the significance value to its termination in a vertical tick to find the comparative genotype. Percentage values for each genotype are listed as (Rh5/(Rh5 +Rh6)/Rh6). (A) Expressing UAS-Dcr2 and UAS-dSmad2RNAi with lGMR-Gal4 reduced pale subtypes (lGMR-Gal4 >UAS-Dcr2; UAS-dSmad2RNAi) (15/0/85) (n = 4) and this reduction was maintained even when UAS-Babo* was co-expressed (lGMR-Gal4 >UAS-Dcr2; UAS-dSmad2RNAi; UAS-Babo*) (23/0/77) (n = 7) (B). (C) Expressing UAS-Dcr2 and UAS-madRNAi with lGMR-Gal4 also reduced pale subtypes (lGMR-Gal4 >UAS-Dcr2; UAS-MadRNAi) (4/0/96) (n = 7). (D) Expressing UAS-Tkv* could not rescue MadRNAi-induced loss of pale subtypes (lGMR-Gal4 >UAS-Dcr2; UAS-MadRNAi, UAS-Tkv*) (6/0/94) (n = 9). (E) Quantification of A-D. (F) Wild-type retinas express Melt (red) and Wts (green) in mutually exclusive subsets of R8 cells; Melt (red) with Rh5 (blue) in the pale subset and Wts (green) with Rh6 (not shown) in the alternate, yellow R8 subset. (G) Removing wts (lGMR-Gal4 > UAS-Dcr2; UAS-WtsRNAi) (100/0/0) (n = 8) led to total loss of yellow subtype while removing melt (lGMR-Gal4 > UAS-Dcr2; UAS-MeltRNAi) (2/8/90) (n = 5) resulted in the opposite, loss of pale subtypes (H). (I) Expressing Babo* increased pale subtypes (blue), which was concomitant with a loss of Wts expression (green). (J) Removing melt in retinas that overexpress Babo* (lGMR-Gal4 > UAS-Dcr2; UAS-Babo*; UAS-MeltRNAi) (0/0/100) (n = 11) prevented Babo*-induced pale subtypes. (K) Overexpression of Tkv* increased the number of ommatidia expressing Rh5 (blue) in R8. In this genotype, increased Rh5 expression was often co-expressed with Rh6 (magenta). Increased Rh5 expression was coincident with loss of Wts, even in some instances where Rh6 was still present (white arrows); however, Wts remained in other R8 cells that co-expressed Rh5 + Rh6 (yellow arrowheads). (L) Removing melt from Tkv* retinas (lGMR-Gal4 > UAS-Dcr2; UAS-Tkv*; UAS-MeltRNAi) (7/3/90) (n = 46) resulted in a loss of Tkv*-induced Rh5 expression. (M) While significantly different from wtsRNAi controls (due to extremely low variance), removing wts prevented increased yellow subtypes seen in dSmad2RNAi (lGMR-Gal4 > UAS-Dcr2; UAS-dSmad2RNAi; UAS-WtsRNAi) (95/0/5) (n = 6) and MadRNAi (lGMR-Gal4 > UAS-Dcr2; UAS-MadRNAi; UAS-WtsRNAi) (97/0/3) (n = 12) (N) retinas. (O) lGMR-Gal4 > UAS Yki retinas exhibited 100% pale subtypes (100/0/0) (n = 7). (P) Expressing UAS-Yki overcame the high incident of yellow subtypes induced by expressing BaboRNAi (lGMR-Gal4 > UAS-Dcr2; UAS-BaboRNAi; UAS-Yki) (100/0/0) (n = 6), TkvRNAi (lGMR-Gal4 > UAS-Dcr2; UAS-TkvRNAi; UAS-Yki) (100/0/0) (n = 6) (Q), MadRNAi (lGMR-Gal4 >UAS-Dcr2; UAS-MadRNAi; UAS-Yki) (100/0/0) (n = 6) (R) and dSmad2RNAi (lGMR-Gal4 >UAS-Dcr2; UAS-dSmad2RNAi; UAS-Yki) (100/0/0) (n = 6) (S). (T) Quantification of G-H, J, L-S. Letters (P, Q, O…) have been added to applicable bars to help identify corresponding image panels.
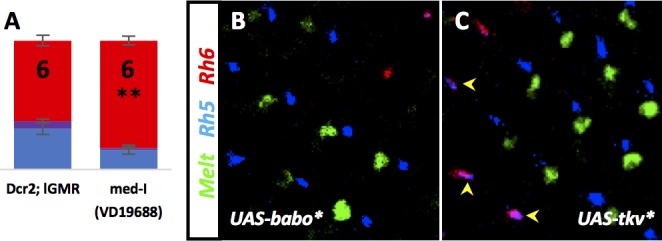
Figure 4—figure supplement 1. Med, Babo, and Tkv are required for R8 subtypes.


