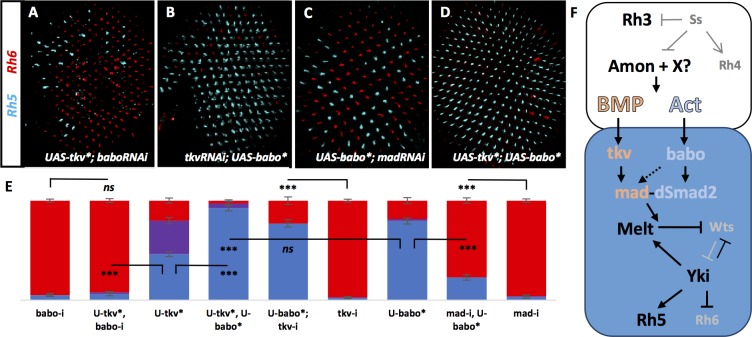
Figure 6. Tkv and Babo signal in parallel to establish a ‘double-checked’ pathway, ensuring correct R7/R8 pairing.
Graph Legend: Red is the percentage of R8 photoreceptors that expressed Rh6, Blue is the percentage that expressed Rh5 and Purple is Co-expression of Rh5 + Rh6. Error bars report standard error of the mean. Paired t-tests were performed against percentages of Rh5 expression and significance is denoted where applicable (***=p ≤ 0.01, ns = not significant). Where significance (or non-significance) is noted, follow the horizontal bar above the significance value to its termination in a vertical tick to find the comparative genotype. Percentage values for each genotype are listed as (Rh5/(Rh5 + Rh6)/Rh6). (A) Removing babo resulted in a high incidence of yellow subtypes even when UAS-Tkv* was expressed (lGMR-Gal4 > UAS-Dcr2; UAS-BaboRNAi; UAS-Tkv*) (6/2/92) (n = 6). (B) Removing tkv could not eliminate increased pale subtypes in UAS-Babo* retinas (lGMR-Gal4 > UAS-Dcr2; UAS-TkvRNAi; UAS-Babo*) (77/0/23) (n = 9). (C) Removing mad significantly reduced pale subtypes induced by expressing UAS-Babo* (lGMR-Gal4 > UAS-Dcr2; UAS-MadRNAi; UAS-Babo*) (23/0/77) (n = 15). (D) Expressing both UAS-Tkv* and UAS-Babo* (lGMR-Gal4 > UAS-Tkv*; UAS-Babo*) (93/5/3) (n = 7) significantly increased pale subtypes above that induced by either alone. (E) Quantification of A-D. (F) Model. Lack of ss in pale R7 cells allows for expression of Amon and possibly other proprotein convertases to activate signaling of BMP and Activin ligands, which activate canonical receptors and R-SMADs Tkv/Mad and Babo/dSmad2, respectively, in R8. Cooperative action of Mad and dSmad2 then regulate the Melt/Wts bi-stable loop, allowing Yki/Sd to induce expression of Rh5 and repression of Rh6.

