. 2017 Aug 26;6:e30038. doi: 10.7554/eLife.30038

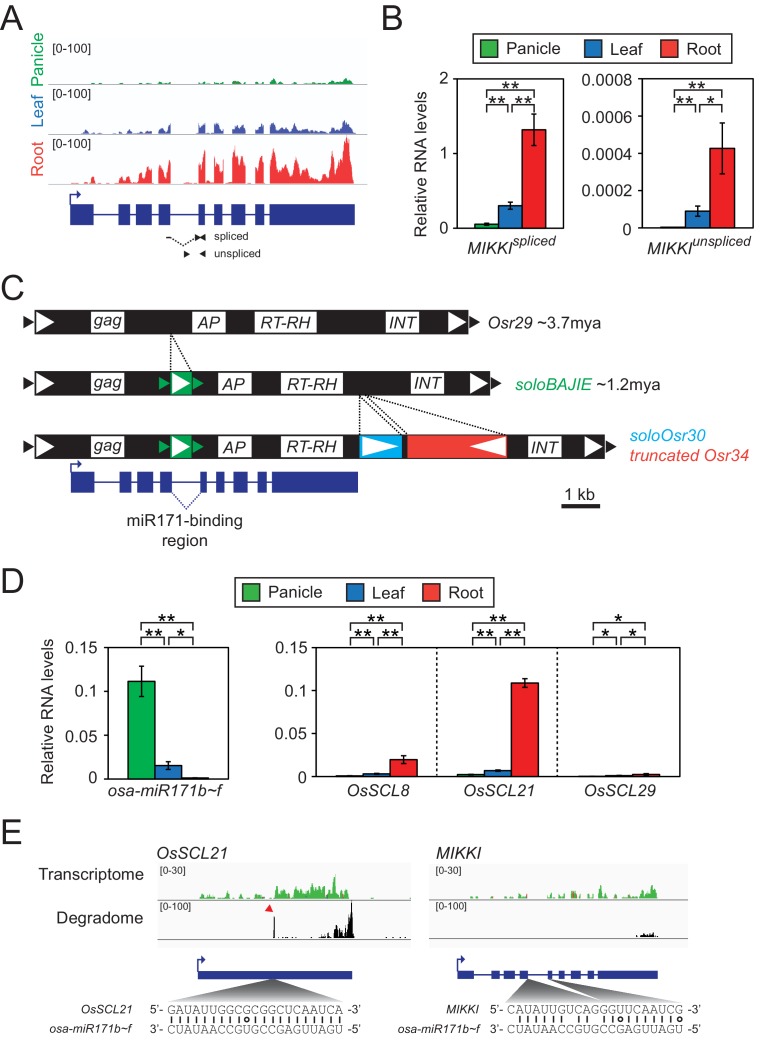
Figure 2. Root-specific MIKKI transcripts may act as target mimics for miR171.

(A) Top, the root-specific expression pattern of MIKKI shown as a snapshot of the RNA-seq genome browser. Bottom, structure of a MIKKI transcript; blue boxes and lines represent exons and introns, respectively. The arrow indicates the transcription start site and the primers used in (B) are indicated as arrowheads. The primer spanning splice junction is shown as a dashed line. (B) MIKKI expression pattern revealed by RT-qPCR. Relative levels of spliced and unspliced MIKKI mRNA in the left and right panels, respectively. Data are presented as mean ± standard deviation (sd) of three biological replicates performed in technical triplicate. The asterisks indicate statistical differences determined by Student’s t-test. **p<0.005; *p<0.05. (C) Schematic diagram of evolution of MIKKI locus. The open and closed arrowheads are the long terminal repeat (LTR) regions and target site duplications, respectively. Different families of retrotransposons are presented by the different colours marked on the right, together with their estimated ages. AP, aspartyl protease; RT-RH, reverse transcriptase-RNaseH; INT, integrase. Intron 4 is shown as a dashed line. (D) Levels of osa-miR171b ~ f and OsSCLs in different tissues as determined by RT-qPCR. Error bars represent mean ± sd of three biological replicates performed in technical triplicate. The asterisks indicate statistical differences determined by Student’s t-test. **p<0.005; *p<0.05. (E) Transcriptome and degradome data from rice panicles showing the OsSCL21 (left) and MIKKI (right) loci. The base pairing of osa-miR171 to OsSCL21 and MIKKI is shown below. The red arrowhead indicates the peak of cleaved end sequences of OsSCL21 mRNA. Watson-Crick and Wobble base-pairing between osa-miR171b ~ f and OsSCL21 or MIKKI are indicated as lines and circles, respectively.

Figure 2.

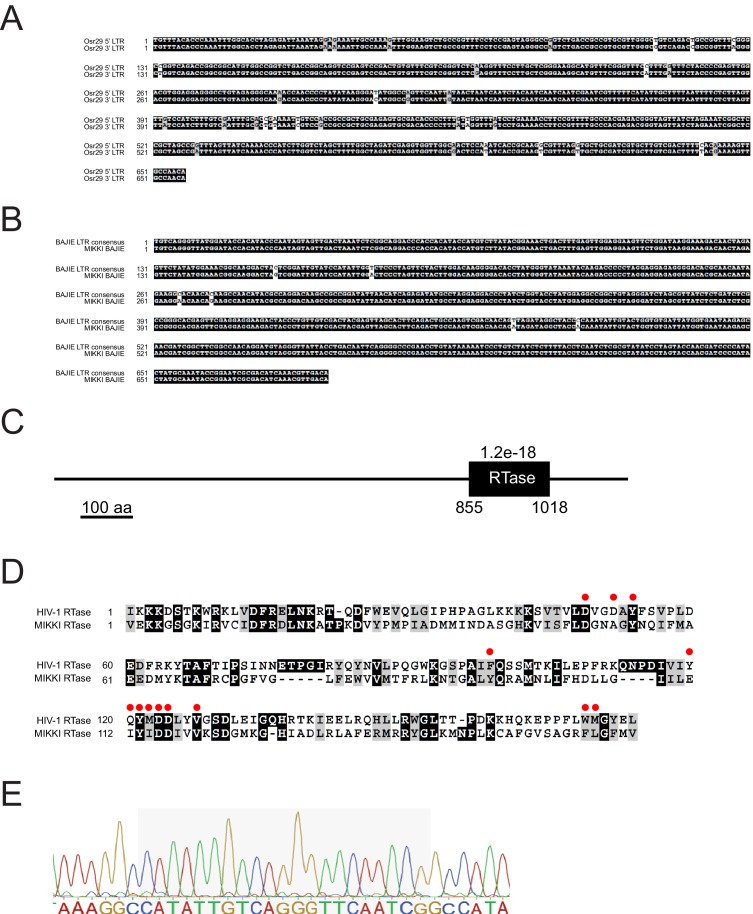
Figure 2—figure supplement 1. Sequence alignment of MIKKI-associated LTRs.

Figure 2—figure supplement 1.

(A) Alignment between two LTRs of Osr29 in MIKKI. (B) Sequence alignment of BAJIE solo LTR and the consensus sequence deduced from all other BAJIE elements. (C) Protein domain prediction of MIKKI using SMART tool (http://smart.embl-heidelberg.de/). The black box is the predicted reverse-transcriptase (RTase) domain and the e-value is shown. Numbers are the start and the end of amino acid residues of RTase domain. (D) Protein sequence alignment of RTases of MIKKI and HIV-1. The amino acid residues constituting the active catalytic site are indicated as red circles (Rodgers et al., 1995). (E) Confirmation of miR171-binding sequence in the exon-exon junction of MIKKI transcript by Sanger sequencing. The shaded box is miRNA-binding region.
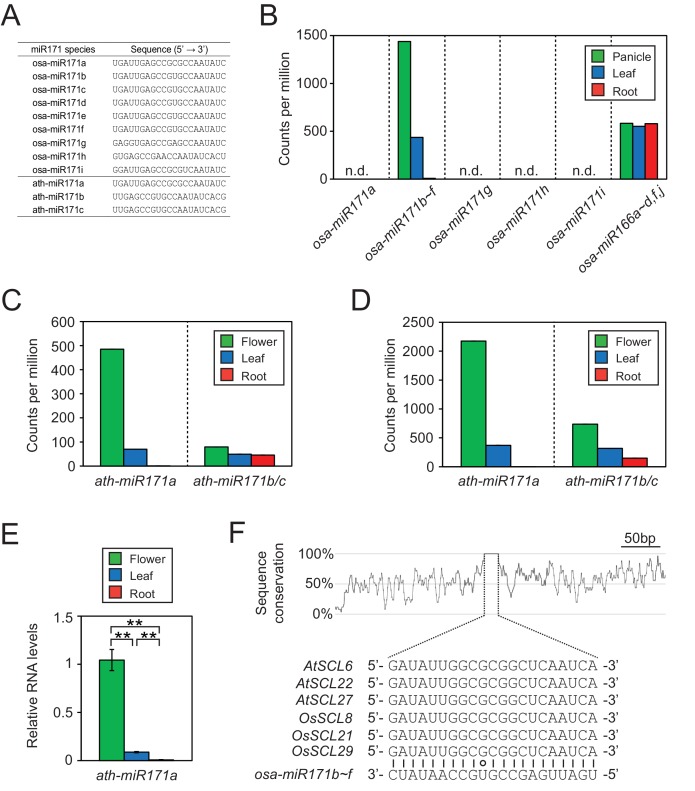
Figure 2—figure supplement 2. Conservation of expression patterns and target sequences of miR171.

Figure 2—figure supplement 2.

(A) Sequences of miR171 species in rice and Arabidopsis obtained from miRBase (http://www.mirbase.org/). (B) Rice miR171 and miR166 levels in public small RNA sequencing data (GSE16350). Read counts are normalized to library size and presented as counts per million. n.d., not detected. (C and D) The abundance of ath-miR171 in public datasets for total (C) and AGO1-associated (D) small RNA (GSE28591). (E) The levels of ath-miR171a determined by RT-qPCR. Normalization was to ath-miR166 levels and data are presented as mean ± sd of three biological replicates performed in technical triplicate. The asterisks indicate statistical differences determined by Student’s t-test. **p<0.005. (F) The region around miR171 binding site in SCL transcripts of Arabidopsis and rice. The conservation plot above the alignment was constructed with the twine package (Pearson and Crews, 2013).