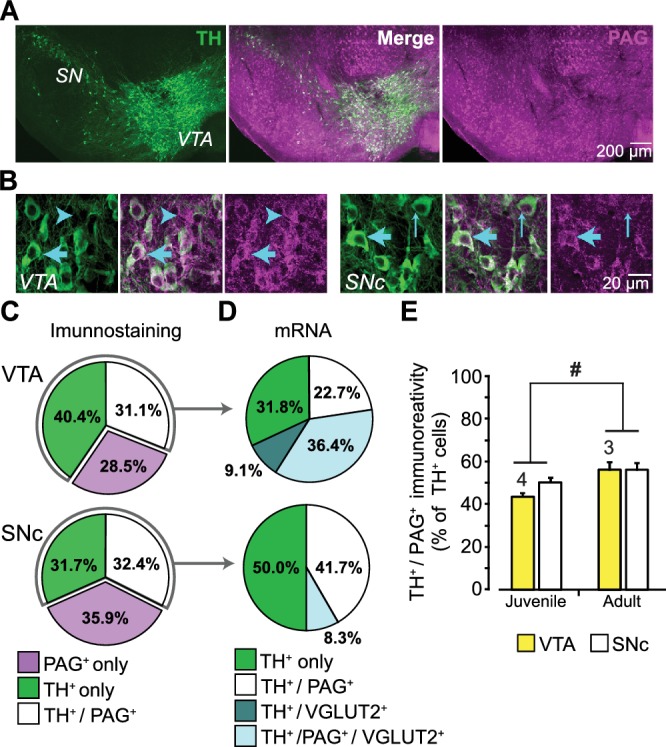
Figure 1. Expression of phosphate-activated glutaminase (PAG) in mouse ventral midbrain DA neurons.
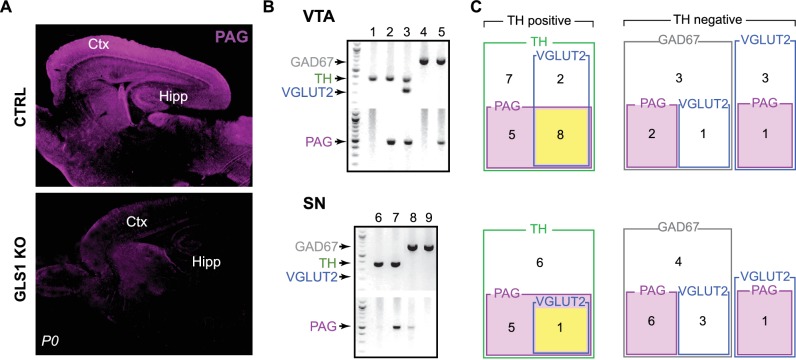
(A) Confocal mosaic z-projected image of the ventral midbrain showing TH (green, left) and PAG (magenta, right) immunoreactivity. Merged image (center) shows that some TH+ DA neurons co-express PAG (white). The specificity of the PAG antibody was verified in GLS1 KO mice; see Figure 1—figure supplement 1A. (B) Magnified confocal images in the VTA (left) and SNc (right) showing TH+ only (thin blue arrow), PAG+ only (blue arrow head) and TH+/PAG+ cells (thick blue arrow). (C) Stereological counts of TH+ only (green), PAG+ only (magenta) and TH+ / PAG+ (white) cells in the VTA and SNc of juvenile (P25) wild type mice (n = 4). Cell numbers in the VTA (TH+only = 4681, PAG+only = 3411, TH+ / PAG+=3673) were greater than in the SNc (TH+only = 2564, PAG+only = 2909, TH+ / PAG+=2595) (two-way ANOVA: main effect of brain region, F(1,18)= 18.36; p<0.001; effect size (ES) partial η2 = 0.51), but the relative proportions of cell types did not differ between regions(main effect of cell type, F(2,18)= 1.22; p=0.318; cell type X brain region interaction, F(2,18)= 2.70; p=0.094). (D) Single-cell RT-PCR analysis of cells expressing TH mRNA, in the VTA and SNc of juvenile mice (P25-37), showing the percentage of cells that co-expressed PAG and VGLUT2 mRNA. In the VTA, most cells were either TH+ only (7/22) or TH+/PAG +/VGLUT2+(8/22); there were also TH+/PAG+ cells (5/22) and rarely TH+/VGLUT2+ (2/22). In the SNc, most cells were either TH+ only (5/12) or TH+/PAG+ cells (6/12); and rarely TH+/PAG+/VGLUT2+ (1/12). No TH+ cells expressed GAD mRNA. For the full coexpression analysis, including GAD mRNA, see Figure 1—figure supplement 1B and C. (E) Comparison of the relative number of TH+ / PAG+ cells in juvenile (P25) and adult (P60) mice. In both the VTA and SNc, there was a significant increase in the number of TH+ / PAG+ cells. # indicates a significant main effect of age (two-way ANOVA, F(1,10)= 8.26; p=0.017, ES partial η2 = 0.45); there was no significant region effect (F(1,10)= 2.154; p=0.173), nor interaction, (F(1,10)= 0.846; p=0.379). See Figure 1—source data 1.xlsx for source data and all statistical analysis.
DOI: http://dx.doi.org/10.7554/eLife.27566.003


