. 2017 Jul 13;6:e27566. doi: 10.7554/eLife.27566

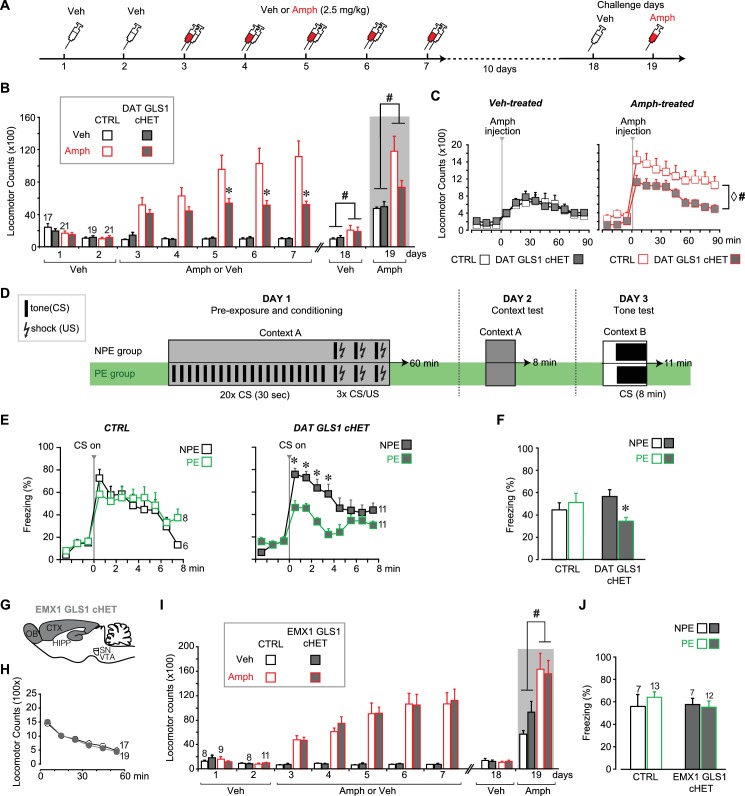
Figure 6. DAT GLS1 cHET mice showed attenuated amphetamine sensitization and potentiated latent inhibition.

(A) Schematic of amphetamine sensitization protocol. (B) Locomotor activity in the open field after vehicle (Veh) or Amphetamine (Amph) injection. There were no between group differences in activity on the habituation days (Days 1 and 2). Over the subsequent 5 treatment days, CTRL mice showed sensitization to Amph while DAT GLS1 cHET mice did not (RM ANOVA, significant genotype X treatment X day interaction, F(4,296) = 4.4, p=0.002, ES partial η2 = 0.06; RM ANOVA within Amph-treated mice, significant genotype X day interaction, F(4,160) = 5.9, p<0.001, ES partial η2 = 0.112). *p<0.016 indicates significantly different from CTRL Amph-treated mice, after Bonferroni correction for 3 comparisons (α = 0.016). On the Veh challenge day (day 18), Amph-treated mice showed a modest increase in locomotion relative to Veh-treated mice independent of genotype. # indicates significant treatment effect (F(1,74)= 4.03, p=0.048; partial η2 = 0.052), but no main effect of genotype (F(1,74)< 0.001, p=1) or significant interaction (F(1,74)= 0.163, p=0.688). On the challenge day (Day 19), Amph-treated mice showed increased locomotion relative to Veh-treated mice independent of genotype. # indicates significant treatment effect (two-way ANOVA: F(1,74) = 13.7, p<0.001, ES partial η2 = 0.112), with no significant genotype effect (F(1,74) = 2.76, p=0.101), but a trend for interaction (F(1,74) = 3.18, p=0.078). (C) On the Amph challenge day Veh-treated (left) and Amph-treated mice (right) received Amph and activity was monitored for 90 min. Veh-treated mice showed no genotypic difference in their response to Amph (RM ANOVA genotype effect, F(1,74) = 0.012, p=0.91; genotype X time interaction, F(1,74) = 0.53, p=0.83). Amph-treated CTRL mice showed a sensitized response to Amph while DAT GLS1 cHET did not. ♢ # indicate a significant genotype difference (RM ANOVA, F(1,40) = 89.3, p=0.034, ES partial η2 = 0.107), and significant effect of time (F(8,320) = 12.8, p<0.0001, ES partial η2 = 0.243), but no significant interaction (F(8,320) = 0.576, p=0.798). stopGLS1 mice, with a global GLS1 HET reduction, show attenuated amphetamine sensitization; see Figure 6—figure supplement 1. ΔGLS1 HET mice, generated by breeding floxGLS1 mice with mice expressing cre under the control of the ubiquitous tamoxifen-inducible ROSA26 promoter (Figure 6—figure supplement 2), also show attenuated amphetamine sensitization (Figure 6—figure supplement 3). (D) Schematic of latent inhibition protocol. (E) On the tone test day (Day 3), the percent time freezing for the 3 min before and 8 min after CS (tone) presentation are shown for CTRL (left) and DAT GLS1 cHET mice (right). CTRL non-preexposure (NPE) and preexposure (PE) groups did not differ, evidencing no LI (RM ANOVA during CS, no preexposure effect, F(2,12) = 0.127, p=0.728; nor preexposure X time interaction, F(7,84) = 1.66, p=0.129). DAT GLS1 cHET NPE and PE groups did not differ before CS presentation (PE effect, F(1,20) = 0.646, p=0.431; interaction, F(2,40) = 2.12, p=0.132); during CS presentation, PE mice showed less freezing than NPE mice, evidencing potentiated LI (RM ANOVA, significant time X PE treatment interaction, F(7,140)= 2.88, p=0.008, ES partial η2 = 0.126). *p<0.006 indicates significant different between PE and NPE groups, after Bonferroni correction for 8 comparisons (α = 0.006). (F) Percent total time freezing during 8 min CS presentation on the tone test (Day 3). DAT GLS1 cHET PE mice, but not CTRL mice, showed less freezing during CS presentation, evidencing potentiated LI (two-way ANOVA, significant genotype X PE treatment interaction, F(1,32)= 5.3, p=0.028, ES partial η2 = 0.334; no significant genotype effect, F(1,32)= 0.145, p=0.71, nor PE effect, F(1,32)= 1.52, p=0.227). Within the NPE group, there was no genotype effect, showing that learning was not affected in DAT GLS1 cHETs (F(1,15)= 1.56, p=0.23). * indicates significant pre-exposure effect within the DAT GLS1 cHET group by ANOVA (F(1,20) = 10.03, p=0.005, ES partial η2 = 0.334). stopGLS1 mice (Gaisler-Salomon et al., 2009b), as well as ΔGLS1 HET mice (Figure 6—figure supplement 3), both with a global GLS1 reduction, show potentiation of LI. (G) Schematic of the EMX1 GLS1 cHET mouse brain (sagittal view) illustrating the GLS1 cHET genotype in forebrain. See Figure 6—figure supplement 4. (H) Novelty-induced locomotion and habituation to the open field did not differ between CTRL (white circles) and EMX1 GLS1 cHET mice (grey circles). RM ANOVA showed a significant time effect (F(5,170) = 138.1, p<0.0001, ES partial η2 = 0.802); no significant genotype effect (F(1,34) = 0.599, p=0.44); and no significant interaction (F(5,170) = 0.820, p=0.537). (I) Both CTRL and EMX1 GLS1 cHET mice showed sensitization to Amph during the 5 treatment days (RM ANOVA: days X drug treatment effect, F(4,128)= 11.33, p<0.0001, ES partial η2 = 0.259; there was no significant day X drug treatment X genotype interaction, F(4,128)= 0.161, p=0.96). On the Veh challenge day, there were no significant differences between genotypes of drug-treatment groups. On the Amph challenge day, Amph-treated mice showed a sensitized response relative to Veh-injected mice, independent of genotype. # indicates a significant main effect of drug treatment (F(1.32) = 16.83, p<0.0001, ES partial η2 = 0.330). (J) EMX1 GLS1 cHET mice did not show potentiation of LI. Percent time freezing during the 8 min CS presentation on the tone test day (Day 3) did not differ between NPE and PE groups, independent of genotype (two-way ANOVA: no significant main effect of genotype, F(1,35)= 0.281, p=0.60; PE, F(1,35)= 0.163, p=0.69; or interaction, F(1,35)= 0.586, p=0.45). EMX1 GLS1 cHET mice, as well as ΔGLS1 HET and DAT GLS1 cHET mice, showed clozapine-induced potentiation of LI (Figure 6—figure supplement 5). In all graphs, the number of mice is shown above the bars or next to the lines. See Figure 6—source data 1.xlsx for source data and statistical analysis.

DOI: http://dx.doi.org/10.7554/eLife.27566.022

Figure 6—source data 1. Amphetamine sensitization and latent inhibition in DAT GLS1 cHET and EMX1 GLS1 cHET mice.
elife-27566-fig6-data1.xlsx (156.8KB, xlsx)
DOI: 10.7554/eLife.27566.023

Figure 6.

Figure 6—figure supplement 1. stopGLS1 HET with a global PAG reduction show attenuated amphetamine sensitization.

Figure 6—figure supplement 1.

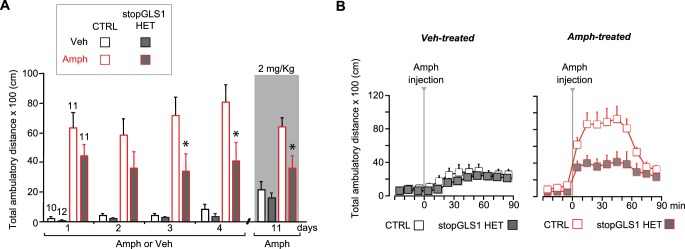
(A) While potentiation of LI is seen in stopGLS1 mice (Gaisler-Salomon et al., 2009b), amphetamine sensitization had not been tested. To test for amphetamine sensitization in stopGLS1 HET mice, Amph (4 mg/kg) or Veh was administered over 4 consecutive days. Amph-treated CTRL mice showed a sensitized response to Amph while Amph-treated stopGLS1 HET mice did not. A three-way RM ANOVA revealed a significant day X genotype interaction (F(3,120) = 3.4, p=0.021, ES partial η2 = 0.078), a treatment X genotype interaction (F(1,40) = 5.85, p=0.020, ES partial η2 = 0.128), and a trend for a day X treatment X genotype interaction (F(3,120) = 2.6, p=0.058, ES partial η2 = 0.060). Analysis of genotype and treatment effects on each day revealed significant genotype X treatment interactions on Day 3 (F(1,40) = 7.68, p=0.008, ES partial η2 = 0.161) and Day 4 (F(1,40) = 7.00, p=0.012, ES partial η2 = 0.149), but not on Days 1 or 2. Analysis of simple effects on Days 3 and 4 revealed a genotype effect within the Amph-treated groups indicated by * (Day 3, F(1,20) = 8.29, p=0.009, ES partial η2 = 0.313; Day 4, F(1,20) = 9.13, p=0.007, ES partial η2 = 0.616). One week later (Day 11), all mice received a lower challenge dose of Amph (2 mg/kg; gray shading). Amph-treated CTRL mice showed a significantly increased response to Amph compared to Veh-treated CTRL mice, revealing sensitization. In contrast, Amph-treated stopGLS1 HET mice showed a slightly increased response to Amph compared to Veh-treated stopGLS1 HET mice, showing reduced expression of sensitization. A two-way ANOVA revealed a significant treatment X genotype interaction (F(1,40) = 4.5, p=0.039, ES partial η2 = 0.103). Analyses within each genotype, showed a significant effect of drug treatment for CTRL mice (F(1,19) = 24.8, p<0.001, ES partial η2 = 0.566), and a trend for treatment in stopGLS1 HET mice (F(1,21) = 4.1, p=0.055, ES partial η2 = 0.164). * indicates significantly different from Amph-treated CTRL mice, analyses of simple main effects. (B) Time course of Amph-induced locomotion for CTRL and stopGLS1 HET mice on the challenge day (Day 11). There were no genotypic differences in baseline activity, prior to Amph injection. After Amph injection, Veh-treated mice — receiving Amph for the first time — showed a modest locomotor response that did not differ genotypically (left graph). Amph-treated mice showed a robust locomotor response to Amph, greater in CTRL than stopGLS1 HET mice (right graph). These differences were supported by a RM ANOVA within each treatment, showing no time X genotype interaction for Veh-treated mice (F(8,160) = 0.782, p=0.619), but a significant time X genotype interaction for Amph-treated mice (F(8,160) = 3.9, p<0.0001, ES partial η2 = 0.165). Taken together, these results indicate that stopGLS1 HET mice show attenuated amphetamine sensitization. Numbers of mice are shown above the bars. Abbreviations: Amph - amphetamine; Veh - vehicle. See Figure 6—figure supplement 1—source data 1.xlsx for source data and statistical analysis.
Figure 6—figure supplement 1—source data 1. Amphetamine sensitization in stopGLS1 HET mice .
DOI: 10.7554/eLife.27566.025
Figure 6—figure supplement 2. Breeding ΔGLS1 HET mice (with a global GLS1 reduction) from floxGLS1 mice.

Figure 6—figure supplement 2.

(A) Inducible Rosa26creERT2: : GLS1lox/+ mice (pink outline) were used to produce a global heterozygous GLS1 inactivation in adulthood by tamoxifen-induced recombination of the floxGLS1 allele. These Rosa26creERT2: : GLS1Δ/+ mice (gray with pink outline) were bred with wild-type (WT) C57BL6 mice (white) to generate ΔGLS1 HET mice (gray). (B) Expression of PAG in the hippocampus (HIPP) of Rosa26creERT2: : GLS1Δ/+ mice after tamoxifen revealed that the protein was reduced to 55.5% of control levels measured in Rosa26creERT2 mice. These mice were bred with WT mice to generate ΔGLS1 HET mice. * indicates significant difference from CTRL (Rosa26creERT2) (ANOVA, F(1,7) = 20.15, p=0.003, ES partial η2 = 0.742). (C) GLS1 allelic abundance for WT and floxGLS1 alleles in ΔGLS1 HET mice showed one WT allele and the absence of the floxGLS1 allele (blue bars) in the hippocampus (HIPP), prefrontal cortex (PFC), dorsal striatum (dStr), thalamus (Thal) and ventral midbrain (VMB), further validating the global heterozygous GLS1 deletion. Allelic abundance data were normalized to CTRL values in GLS1 lox/+ (gray line). See Figure 6—figure supplement 2—source data 2.xlsx for source data and statistical analysis.
Figure 6—figure supplement 2—source data 2. PAG protein determinations in Rosa26ERT2creGLS1 mice.
DOI: 10.7554/eLife.27566.027
Figure 6—figure supplement 3. ΔGLS1 HET mice show reduced novelty-induced locomotion, attenuated amphetamine sensitization and potentiated latent inhibition.

Figure 6—figure supplement 3.

(A) Novelty-induced locomotion, but not habituation, was reduced in ΔGLS1 HET mice. ◊ indicates a significant main effect of genotype (RM ANOVA: F(1,33) = 5.98, p<0.020, ES partial η2 = 0.153). # indicates a significant main effect of time (F(5,165) = 91.92, p<0.001, ES partial η2 = 0.736); there was no significant interaction (F(5,165) = 0.942, p=0.455). (B) ΔGLS1 HET mice were tested for amphetamine sensitization following a similar protocol and drug dose to that used for DAT GLS1 cHET mice (Figure 6A). After Veh injections (Days 1 and 2), ΔGLS1 HET mice were overall less active that CTRL mice. This was supported by a 2 (genotype) x 2 (treatment) x 2 (days) ANOVA that showed a significant main effect of genotype (F(1,31) = 17.03, p<0.001, ES partial η2 = 0.355) indicated by ◊, but no other significant main effects or interactions. During the 5 consecutive treatment days, Amph-treated ΔGLS1 HET mice showed both a blunted response to acute amphetamine and no sensitization. This is reflected in the 2 (genotype) x 2 (treatment) x 5 (days) ANOVA by the absence of a significant genotype X drug treatment X days interaction (F(4,124) = 0.733, p=0.585), but a significant genotype X drug treatment interaction (F(1,31) = 13.2, p=0.001, ES partial η2 = 0.299). Analysis of genotype and treatment effects on each day revealed significant genotype X treatment interactions on all days except Day 4 (Day 3, F(1,31) = 10.14, p=0.03; Day 4, F(1,31) = 3.73, p=0.063; Day 5, F(1,31) = 15.00, p=0.001; Day 6, F(1,31) = 11.64, p=0.002; Day 7, F(1,31) = 10.56, p=0.003). Analysis of simple effects on Days 3, 5, 6 and 7 revealed a genotype effect within the Amph-treated groups indicated by * (Day 3, F(1,19) = 18.21, p<0.001; Day 5, F(1,19) = 21.57, p<0.001; Day 6, F(1,19) = 18.97, p<0.001; Day 7, F(1,19) = 17.82, p<0.001; ES partial η2 > 0.400 for all). After a withdrawal period, on Day 19, all mice received Amph (2.5 mg/kg). Amph-treated CTRL mice showed a sensitized locomotor response compared to ΔGLS1 HET mice, yet due to a ceiling effect the responses of Amph-treated and Veh-treated CTRL mice did not differ. ◊ indicates significant main effect of genotype (two-way ANOVA: F(1,31) = 10.6, p=0.003, ES partial η2 = 0.254). There was no significant drug treatment effect (F(1,31) = 3.64, p=0.066) or interaction (F(1,31) = 2.56, p=0.120). Four days later (Day 23), mice received a low-dose Amph challenge (1.25 mg/kg). Amph-treated CTRL mice showed a sensitized response compared to Veh-treated mice and Amph-treated ΔGLS1 HET mice (two-way ANOVA: significant genotype X drug treatment interaction, F(1,31) = 4.22, p=0.048, ES partial η2 = 0.120). * indicates significant genotype effect for Amph-treated mice (ANOVA, F(1,31) = 5.20, p=0.034, ES partial η2 = 0.215). (C) ΔGLS1 HET mice were tested for potentiation of LI, following the same protocol as used for the DAT GLS1 cHETs (Figure 6D). The graph shows percent time during the 8 min CS presentation on the test day (Day 3). There was no difference between NPE and PE CTRL groups. ΔGLS1 HET PE mice froze less during the CS exposure revealing a potentiated LI response (two-way ANOVA: significant genotype X PE interaction, F(1,24) = 5.40, p=0.029, ES partial η2 = 0.183). * indicates a significant PE effect for ΔGLS1 HETs (ANOVA: F(1,10) = 11.2, p=0.007, ES partial η2 = 0.530). Numbers of mice are shown either next to the lines or above the bars. Abbreviations: Amph - amphetamine; Veh - vehicle; PE - preexposed group; NPE - non-preexposed group. See Figure 6—figure supplement 3—source data 3.xlsx for source data and statistical analysis.
Figure 6—figure supplement 3—source data 3. Novelty-induced locomotion and amphetamine sensitization in ΔGLS1 HET mice.
DOI: 10.7554/eLife.27566.029
Figure 6—figure supplement 4. Conditional forebrain PAG reduction in EMX1 GLS1 cHET mice.

Figure 6—figure supplement 4.

(A) Validation of the forebrain-specific GLS1 deletion in EMX1 GLS1 cKO mice using PAG immunoreactivity. P18 mice were used, as EMX1 GLS1 cKO mice die by P21. PAG immunoreactivity in EMX1 GLS1 cKO mice was absent in HIPP and PFC, but not Thal. (B) GLS1 allelic abundance for WT and floxGLS1 alleles in EMX1 GLS1 cHET mice showed that the floxGLS1 allele was reduced to 38% in the HIPP and 44% in the PFC, but not affected in the dStr and Thal, further validating the regional specificity of the EMX1cre-induced heterozygous GLS1 reduction. Allelic abundance data were normalized to CTRL values in GLS1 lox/+ (gray line). (C) PAG protein expression in the hippocampus of EMX1 GLS1 cHET mice. PAG protein was reduced to 52% of CTRL. * indicates significant difference from CTRL (EMX1cre) (one-way ANOVA, F(1,19) = 51.38, p<0.0001, ES partial η2 = 0.730). The number of mice is shown above the bars. See Figure 6—figure supplement 4—source data 4.xlsx for source data and statistical analysis.
Figure 6—figure supplement 4—source data 4. PAG protein determinations in EMX1 GLS1 cHET mice.
DOI: 10.7554/eLife.27566.031
Figure 6—figure supplement 5. Clozapine-induced potentiation of latent inhibition in EMX1 GLS1 cHET, ΔGLS1 HET and DAT GLS1 cHET mice.

Figure 6—figure supplement 5.

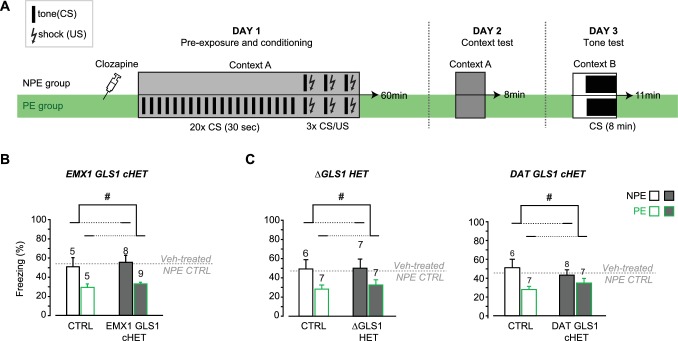
(A) Schematic of the LI protocol to test the effect of clozapine using the same protocol used for the DAT GLS1 cHETs (Figure 6D). Both NPE and PE groups received a single injection of clozapine (1.5 mg/kg) on Day 1, 30 min before being put in the conditioning boxes. (B) EMX1 GLS1 cHET mice were tested for potentiation of LI following pretreatment with clozapine. Graph shows percent freezing on the tone test (Day 3) during the 8 min CS presentation. Clozapine decreased freezing in CTRL and EMX1 GLS1 cHET PE groups, revealing potentiation of LI. # indicates a significant main PE effect (two-way ANOVA, F(1,23) = 13.13, p=0.001, ES partial η2 = 0.363); there was no significant main effect of genotype (F(1,23) = 0.452, p=0.508) or interaction (F(1,23) = 0.002, p=0.967). The percent time freezing of clozapine-treated NPE groups was similar to the freezing reported for vehicle-treated NPE groups (dashed grey line) indicating that clozapine did not affect aversive associative learning. (C) ΔGLS1 HET (left) and DAT GLS1 cHET (right) mice were tested for potentiation of LI following pretreatment with clozapine. Clozapine pretreatment selectively decreased freezing in the PE groups, revealing potentiation of LI, independent of genotype. # indicates a significant main PE effect (two-way ANOVA: for ΔGLS1 HETs, F(1,23) = 6.74, p=0.016, ES partial η2 = 0.227; DAT GLS1 cHETs, F(1,24) = 6.06, p=0.021, partial η2 = 0.202); there was no significant main effect of genotype (ΔGLS1 HETs, F(1,23) = 0.120, p=0.732; DAT GLS1 cHETs, F(1,24) = 0.069, p=0.794) or interaction (ΔGLS1 HETs, F(1,23) = 0.051, p=0.824; DAT GLS1 cHETs, F(1,24) = 1.978; p=0.172). The percent time freezing of clozapine-treated NPE groups was similar to the freezing reported for Veh-treated NPE groups (dashed gray line) indicating that clozapine did not affect aversive associative learning. The number of mice is shown above the bars. See Figure 6—figure supplement 5—source data 5.xlsx for source data and statistical analysis.
Figure 6—figure supplement 5—source data 5. Clozapine-induced potentiation of latent inhibition.
DOI: 10.7554/eLife.27566.033