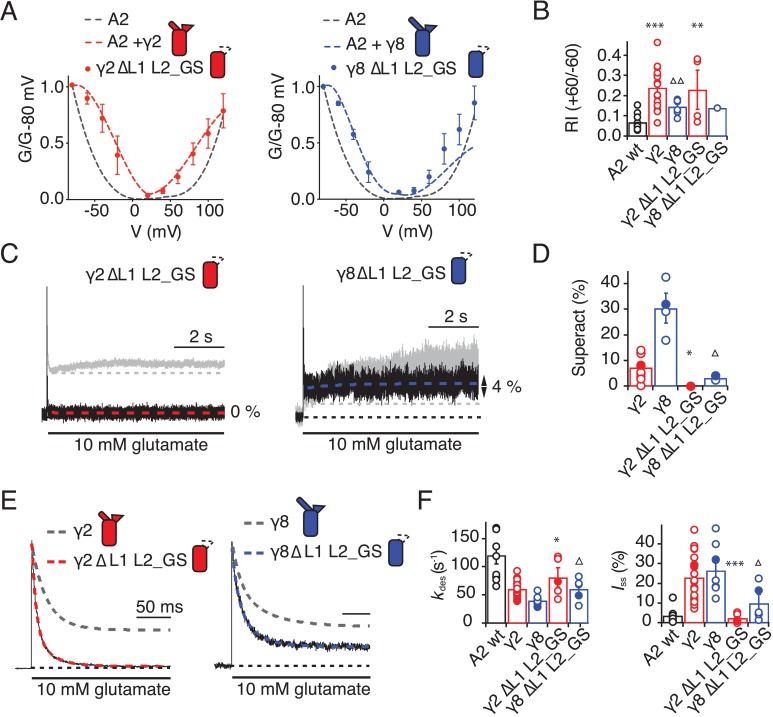
Figure 6. Eliminating L1 and L2 removes modulation by γ2.
(A) Mutation of both L1 and L2 in γ2 (left) and γ8 (right) did not change association of TARPs with AMPA receptors, as assessed by the G-V curve. GluA2 WT is shown in grey. (B) Bar graph summarizing the rectification index of the dual loop mutations. (C) Example traces of γ2 ΔL1 L2_GS (left) and γ8 ΔL1 L2_GS (right) in response to 7 s application of 10 mM glutamate. Corresponding wild-type TARPs are shown as dashed lines. (D) Bar graphs summarizing the effects of the dual loop mutation in γ2 (red) and γ8 (blue) on superactivation. (E) Representative traces from γ2 ΔL1 L2_GS (left) and γ8 ∆L1 L2_GS (right) coexpressed with GluA2 in response to a 500 ms pulse of 10 mM Glutamate (kdes = 74 and 50 s−1 Iss = 1.5% and 16%, respectively). Currents from the parent TARPs are shown in grey. (F) Bar graphs summarizing the effects of the dual loop mutation in γ2 (red) and γ8 (blue) on desensitization decay and the steady state current. Currents were recorded at +50 mV in the presence of 50 µM spermine in the pipette solution. For panels D, F and G, filled symbols correspond to the traces shown in (C) and (E). ***p<0.001, **p<0.01, *p<0.05, against γ2. Source data for panel B is found in Figure 6—source data 1. Source data for panels D, F and G is found in Table 1–source data 1. Error bars represent s.e.m.

