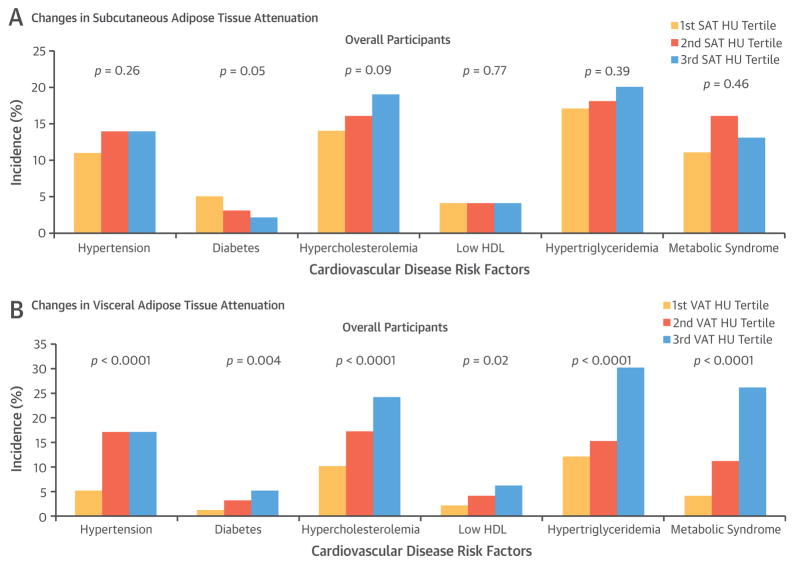
FIGURE 1. Incidence of Cardiovascular Disease Risk Factors According to the Tertiles of Changes in SAT and VAT Attenuation in Overall Participants.
Tertile 3 corresponds to more decrease (i.e., more negative) in the change in adipose tissue attenuation, as compared to tertile 1. The linear trend for each cardiovascular disease risk factor model is shown as a single p value. HDL = high-density lipoprotein cholesterol; HU = Hounsfield units; SAT = subcutaneous adipose tissue; VAT = visceral adipose tissue.

