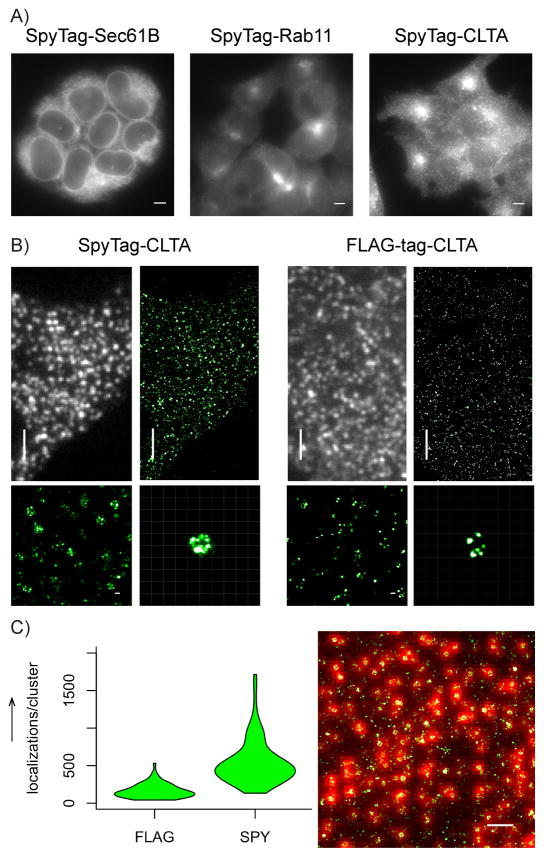
Figure 2.
SpyTag-SpyCatcher labelling of endogenous proteins. (A) Wide-field images of knock-in HEK293T cells stained with SpyCatcher-A647: SpyTag-sec61B (left), SpyTag-rab11 (center), SpyTag-CLTA (right). Scale bars: 5 μm. (B) Comparison of wide-field and STORM images of endogenous CLTA labelled by SpyTag knock-in and SpyCatcher staining (left), and by FLAG-tag knock-in cell and anti-FLAG-tag indirect immunofluorescence. Scale bars and grids: 3 μm for wide-field and zoomed-out STORM images, 100 nm for zoomed inserts. (C) Quantification of number of localization points per clathrin structure (n = 72 clusters in either condition). Right panel shows an example STORM image overlaid on its corresponding wide-field image used for identifying clathrin structures. Scale bar: 1 μm.

