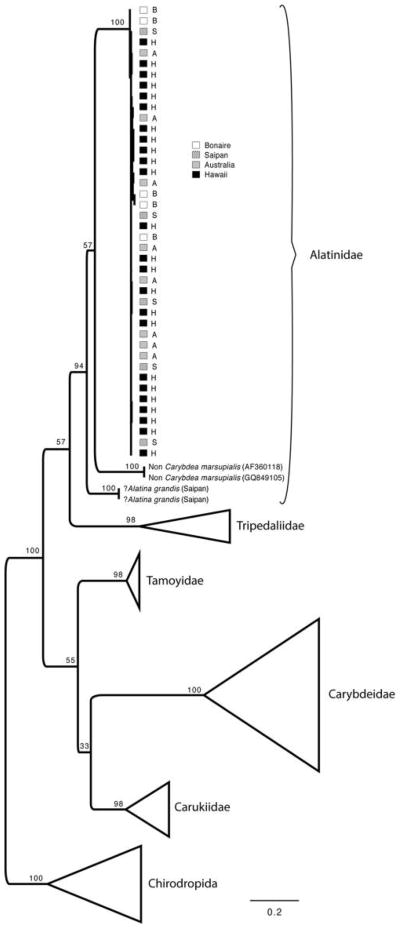
Figure 3.
Maximum-likelihood (ML) topology of the mitochondrial 16S of sampled Alatina specimens clustered within a cubozoan phylogeny, assuming the TIM2+I+G model of nucleotide evolution. ML nonpara-metric bootstrap support values are indicated for each node. Squares following legend indicate geographical origin of sampled specimens.

