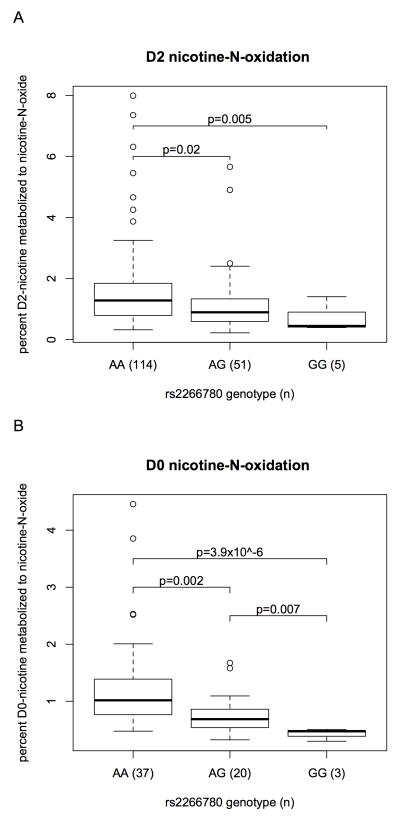
Figure 1.
rs2266780 genotype associated with (A) deuterated (d2)-nicotine N-oxidation (d2-nicotine-N-oxide/(d2-nicotine + d2-nicotine-N-oxide + d2-cotinine + d2-trans-3'-hydroxycotinine + d2-nicotine-glucuronide) 4 hours after oral administration, and (B) ad libitum smoked nicotine N-oxidation (nicotine-N-oxide/(nicotine + nicotine-N-oxide + cotinine + trans-3'-hydroxycotinine + nicotine-glucuronide). The boxplots provide summaries of the data distributions for each group of (n) subjects. A box represents the interquartile range, which includes 50% of values. The line across the box indicates the median. The whisker lines extend to the highest and lowest values that are within 1.5x the interquartile range. Further outliers are marked with circles.

