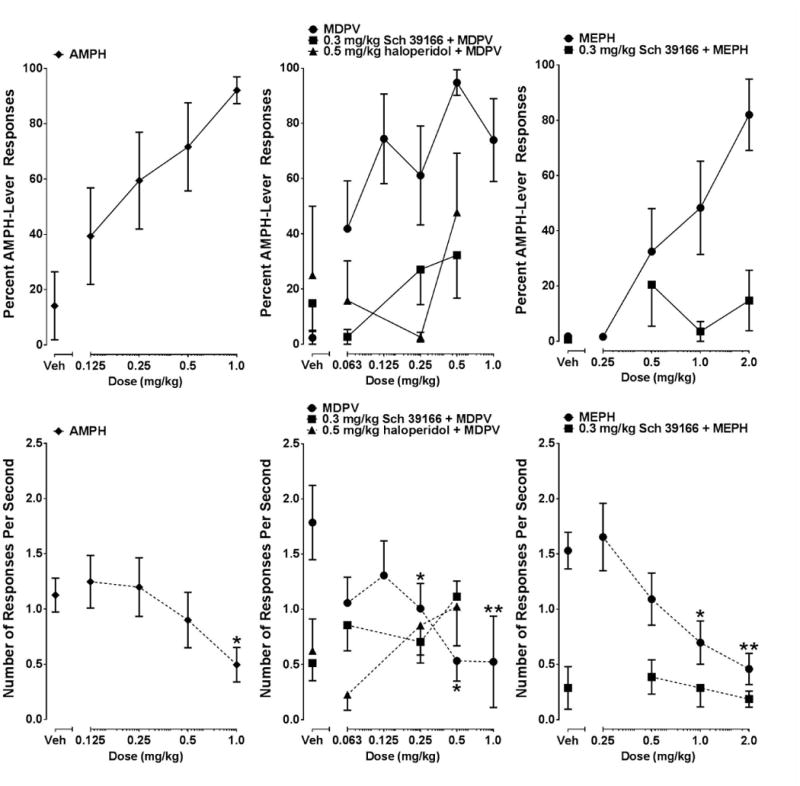
Figure 1.

Dose-response curves determined from stimulus generalization tests with AMPH, MDPV, and MEPH and stimulus antagonism tests with 0.3 mg/kg Sch 39166 or 0.5 mg/kg haloperidol in combination with selected doses of MDPV or MEPH in rats trained to discriminate 0.5 mg/kg AMPH from saline (n=8). Graphs in the upper panel depict percentage of responses on the AMPH-appropriate lever. Graphs in the lower panel depict response rate. Individual points represent group means (± SEM). Significant Dunnett's multiple comparison tests on response rate between selected doses and vehicle are represented by * (p < .05) or ** (p < .01).
