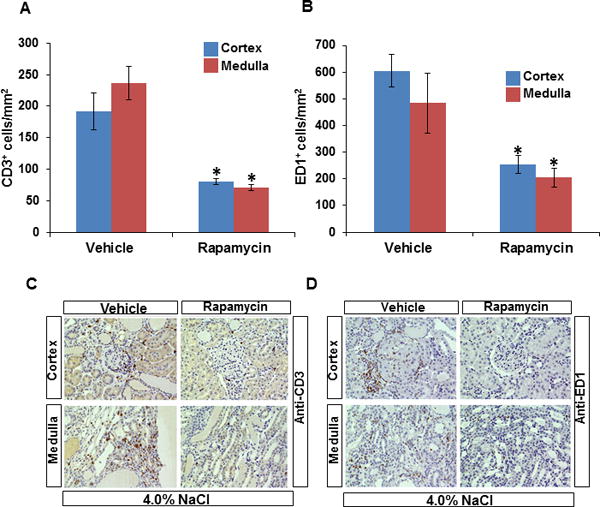
Figure 5.

Quantification of T lymphocytes (CD3+) and macrophages (ED1+) cells per mm2 of kidneys of SS rats treated with vehicle (n=7) or rapamycin (n=9) after 21 days of the 4.0% NaCl diet. A, CD3+ cells/mm2 in the renal cortex and outer medulla B, ED1+ cells/mm2 in the renal cortex and outer medulla C, representative kidney sections illustrating the immunohistochemical localization of T cells and macrophage cells (D) in the renal cortex and outer medulla. Blue and brown column on bar graph represent cortex and outer medulla, respectively. * p<0.05 Vs vehicle.
