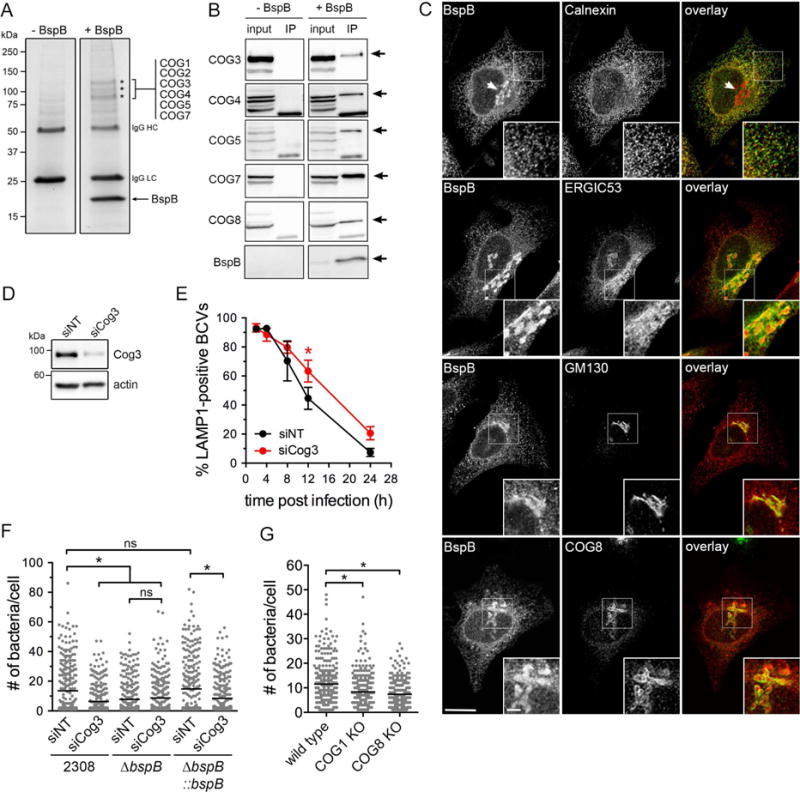
Figure 3. The Conserved Oligomeric Golgi (COG) complex co-immunoprecipitates with BspB and is required for rBCV biogenesis and bacterial replication.

(A) Representative co-immunoprecipitation of HA-BspB with COG subunits. HA-BspB expressed in HeLa cells was immunoprecipitated using anti-HA-conjugated magnetic beads and co-immunoprecipitated proteins (asterisks) absent from control (−BspB) were identified by SDS-PAGE followed by micro-capillary LC/MS/MS.
(B) Representative Western blot analyses of co-immunoprecipitates from control (−BpsB) and HA-BspB-expressing (+BspB) HeLa cells probed with antibodies against COG3, 4, 5, 7 and 8 subunits. Arrows indicate the corresponding COG subunit band. Input was 4% of clarified cell lysates.
(C) Representative confocal micrographs of HeLa cells transfected with a plasmid expressing HA-tagged BspB (red) and immunostained for calnexin, ERGIC53, GM130 or COG8 (green). Scale bar, 10 μm.
(D) Representative Western blot analysis of Cog3 depletion in BMMs upon siRNA nucleofection, compared to non-targeting siRNA (siNT) treatment. β-actin was used as loading control.
(E) BCV remodeling in BMMs treated with either siNT or siCog3 siRNAs for 72 h prior to infection with DsRedm-expressing B. abortus wild type bacteria (2308::mTn7K-DsRedm). Data are means ± SD from 3 independent experiments. Asterisks indicate statistically significant differences compared to siNT control as determined by a two-way ANOVA with Bonferroni’s multiple comparisons test (P<0.05).
(F) Brucella replication in BMMs treated with either siNT or siCog3 siRNAs for 72 h prior to infection with DsRedm-expressing B. abortus wild type (2308), ΔbspB or complemented ΔbspB strains for 24 h. Lines indicate the means from 3 independent experiments.
(G) Replication of DsRedm-expressing Brucella in either wild type, COG1, or COG8 KO HEK293T cells at 12 h pi. Lines indicate the means from 3 independent experiments. Asterisks in (F) and (G) indicate statistically significant differences compared to control determined by a Kruskal-Wallis test with Dunn’s multiple comparisons test (P<0.05). ns, not significant.
See also Figure S2.
