
Figure 3.
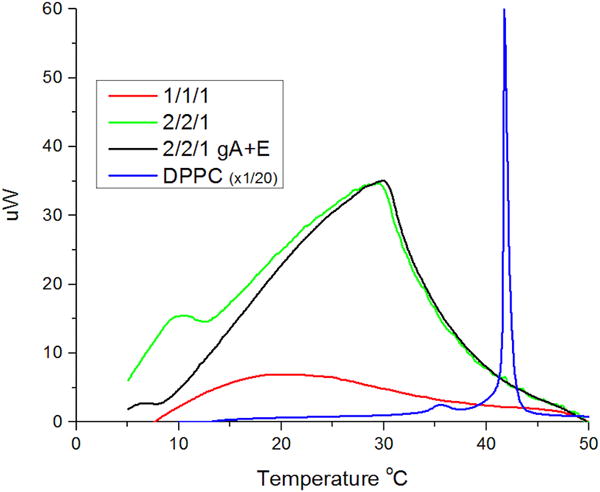
differential scanning calorimetry of lipid mixtures. scans are records from cooling scans staring at 60 °C and ending at 5° C, at a rate of 1 °C/minute. green line represents dopc/spm/chl 2/2/1 multilamellar vesicle 25 mg/ml. the black line represents dopc/spm/chl multilamellar vesicle 25 mg/ml with 100× the amount of gramicidin and twice the amount of ethanol used in electrophysiology experiments. the red line represents dopc/spm/chl 1/1/1 multilamellar vesicles 30mg/ml. the blue line represents dppc 5 mg/ml at 1/20 the scale for reference.