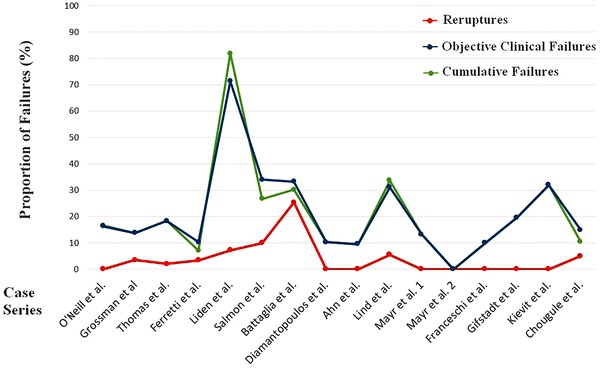
Fig. 2.

This figure displays a graphic representation of the proportion of reruptures (red line), objective clinical failures (blue line), and cumulative failure (green line) of the different studies. The proportions (from 0% to 100%) are displayed in the vertical line, whereas the case series are displayed in chronological order of publication in the horizontal line.
