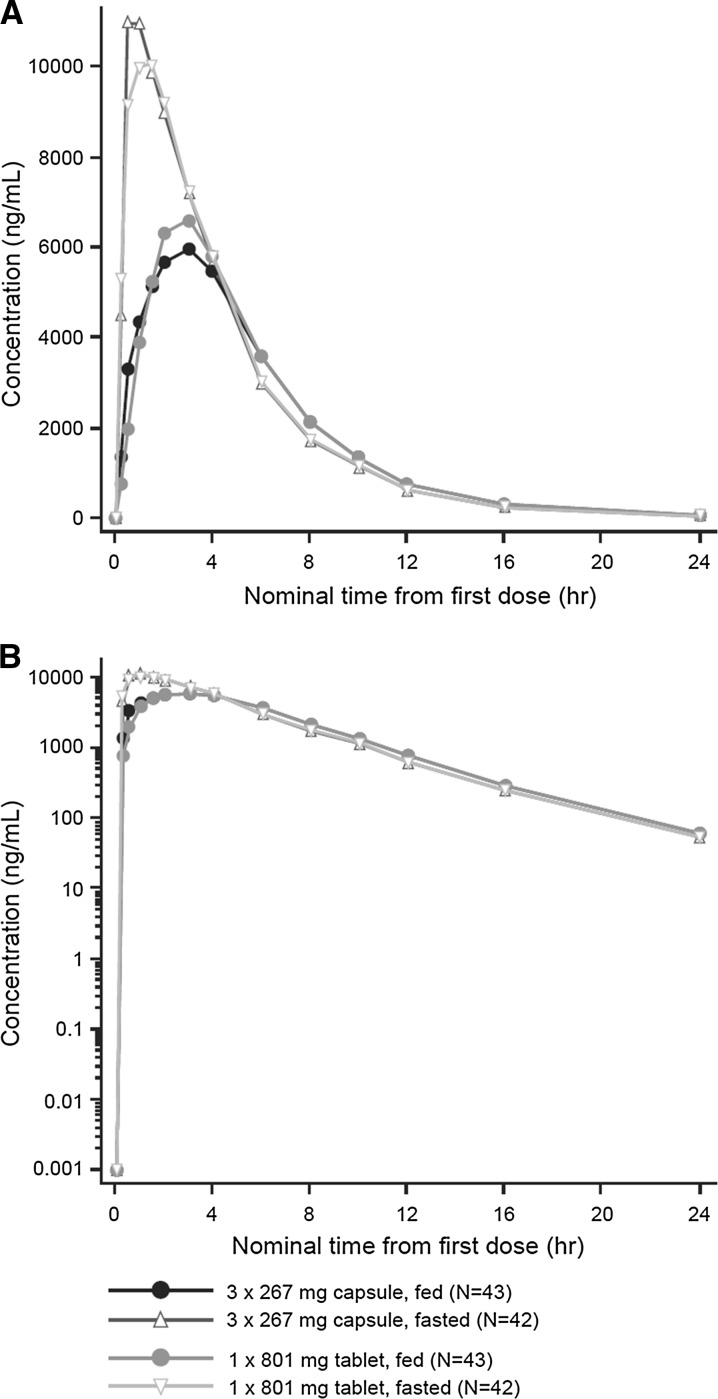
Fig. 2.
Mean plasma concentrationa versus time profiles with a linear and b semi-logarithmic scales. Plasma concentration values below limit of quantitation (BLOQ) were set to zero except when a BLOQ fell between two quantifiable values, in which case it was treated as missing data. One subject who was fasted and fed and one subject who was fasted only were excluded from descriptive statistics calculations because of vomiting within 6 h of dosing
a Mean concentration calculated from individual plasma concentration at the same time point

