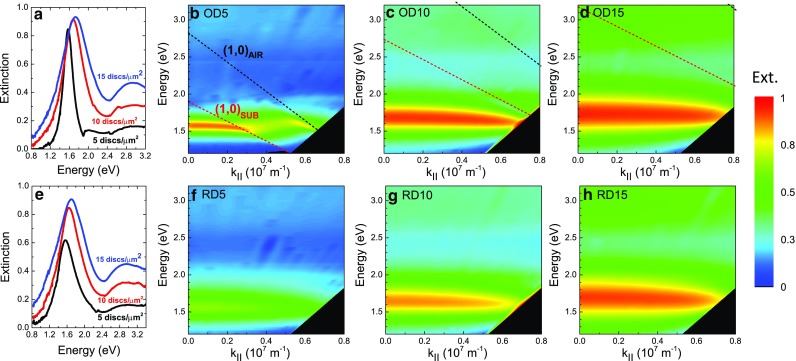
Fig. 2.

Experimental contour plots of the extinction spectra obtained from the transmittance measurements of the fabricated gold nanodisc arrays with p-polarized light at different parallel wavevector components. a and e represent the extinction line cuts at normal incidence as a function of the particle density for, respectively, the ordered and random cases. In the top row, the ordered nanodisc arrays are shown with density of b 5 discs/μm2, c 10 discs/μm2, and d 15 discs/μm2. In the bottom row, the random nanodisc arrays are shown with density f 5 discs/μm2, g 10 discs/μm2, and h 15 discs/μm2. Rayleigh-Wood’s diffraction modes (1,0)AIR and (1,0)SUB are represented in b, c, and d, respectively, in black and red dashed lines
