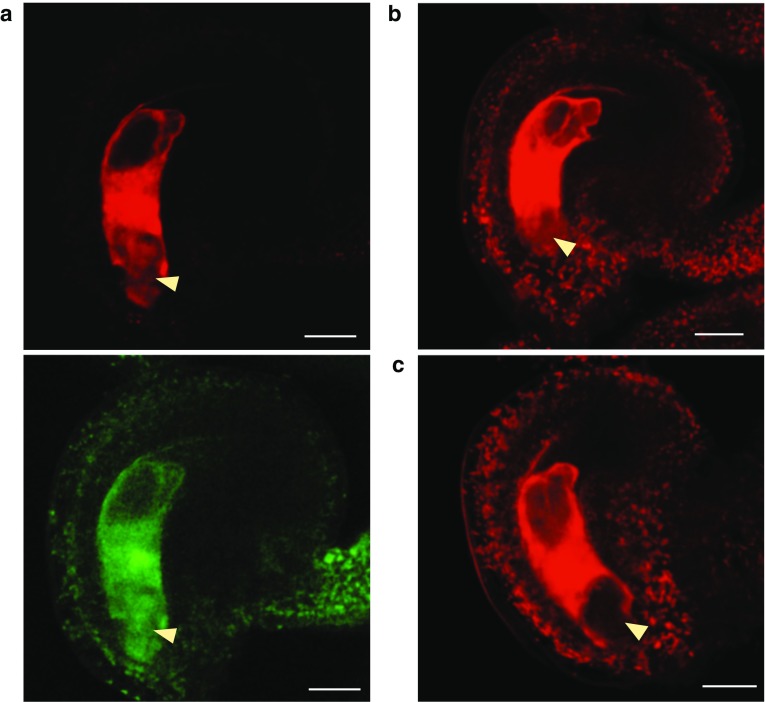
Fig. 2.
Assaying small RNA movement between the cells of the female gametophyte using a FRET system a Pre-fertilization injection of 24 nucleotide RNA “A.” Total sRNA signal shown in red, single-stranded signal shown is green. Movement is observed. b Pre-fertilization injection of 24 nucleotide RNA “B,” showing total sRNA signal. Image captured 60 min following injection. Movement is observed. c Pre-fertilization injection of 24-nucleotide RNA “B,” showing total sRNA signal. Image captured 65 min following injection. No movement is observed. Yellow arrowheads indicate the position of the egg apparatus. Scale bars, 20 μm

