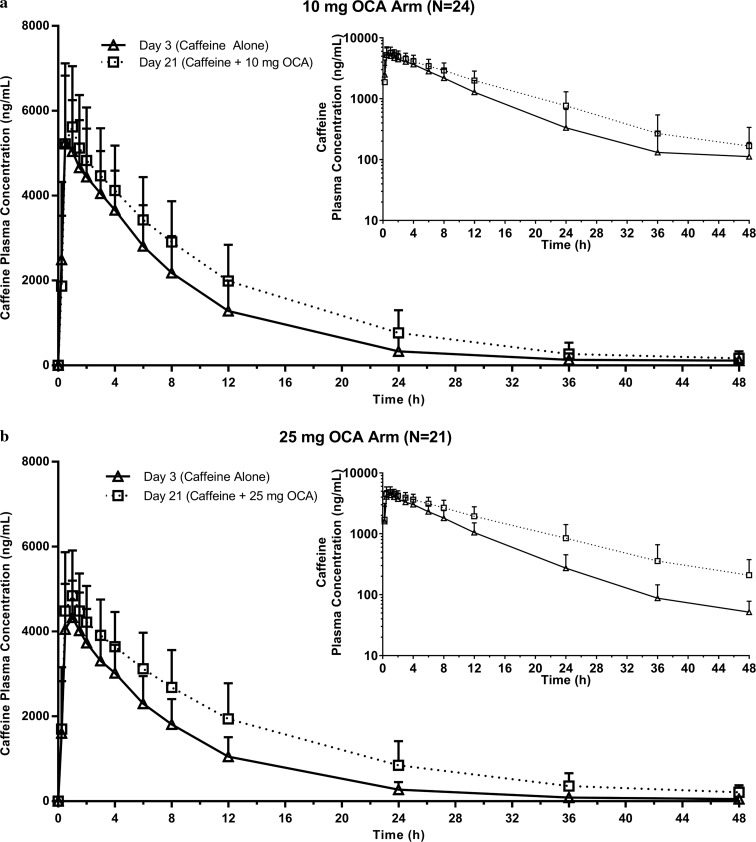
Fig. 1.
Pharmacokinetic profile of caffeine. Data are mean (+SD) plasma caffeine concentrations versus time following a single 200-mg dose of caffeine administered alone (solid line, triangles) and with 10 mg (a) or 25 mg (b) OCA (dotted line, squares). Main figures display caffeine plasma concentration on a linear scale, and insets display log scale. Includes patients from caffeine PK population (N = 45)

