Fig. 5.
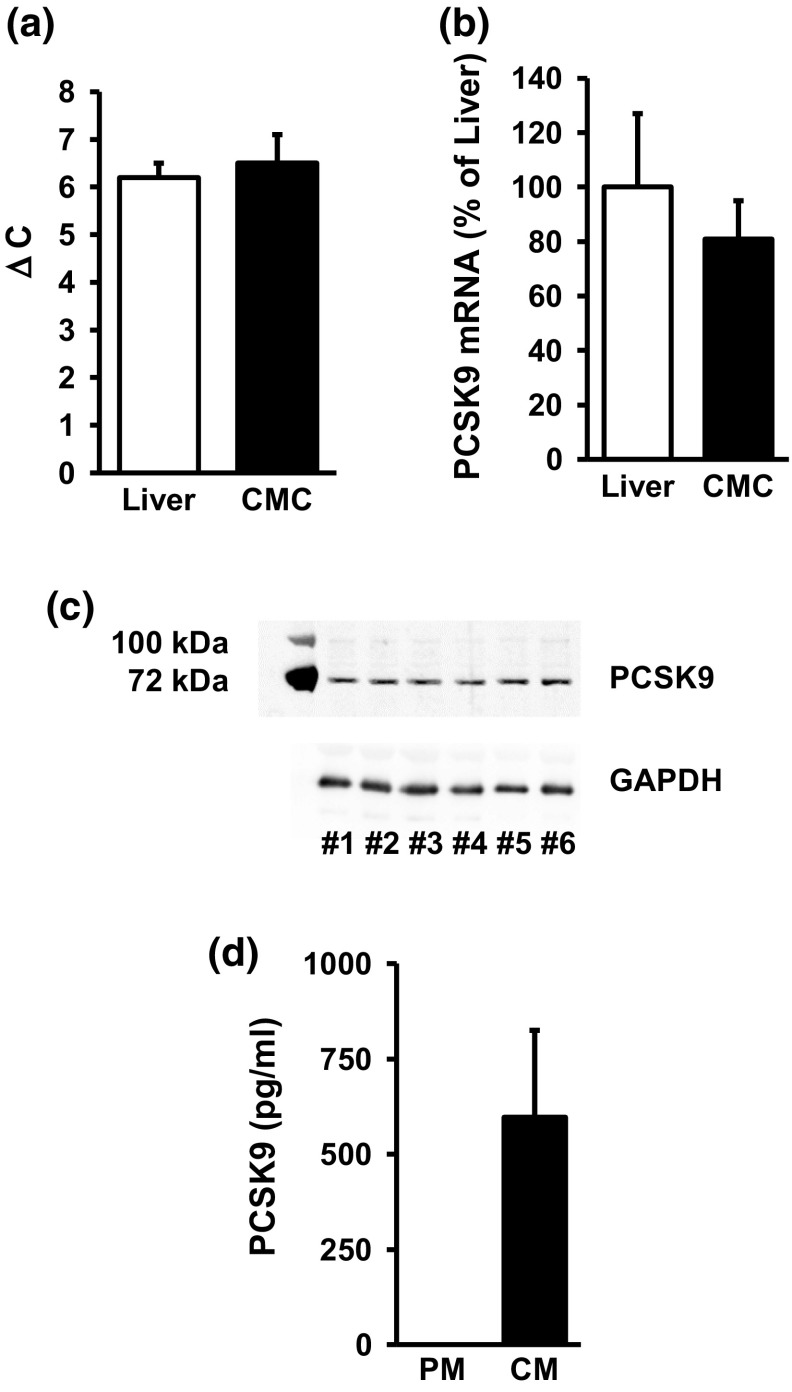
Expression of PCSK9 in liver and cardiomyocytes (CMC). a Cycle number for the threshold of PCSK9 amplification of the samples are given for (n = 10, eight independent experiments, CMC) and liver isolated from normotensive rats (n = 5). Data are normalized to the mean expression of the three house-keeping genes GAPDH, HPRT, and B2M. b Relative expression of PCSK9 in cardiomyocytes normalized to the expression in liver. All data are normalized to the three house-keeping genes. Data are mean ± SD. p > 0.05. c Representative immunoblot indicating the expression of PCSK9 (top) and GAPDH (bottom). Original blot is shown in supplementary Figure 1. d Release of PCSK9 into the medium (PM plain culture medium, CM conditioning medium, 24 h incubation, n = 6); data shown are mean ± SD from n independent preparations

