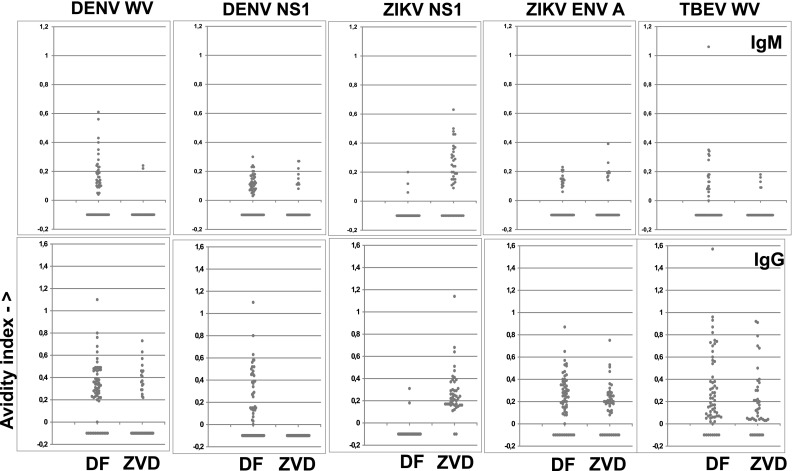
Fig. 6.

Avidity indices (AI; ratio of MFI after and before urea, Y-axis) of the antibody reactions of selected antigens with sera from patients with DF (n = 61) and ZVD (n = 43). Upper frames IgM, lower frames IgG. Each frame shows the AIs for a DENV, ZIKV, or TBEV antigen, either WV (WV) or NS1. AIs were not calculated if the reactivity of urea untreated bead was less than 300 MFI. Sera with such results are shown as −0.1 on the Y-axis. Only results with selected antigens are shown
