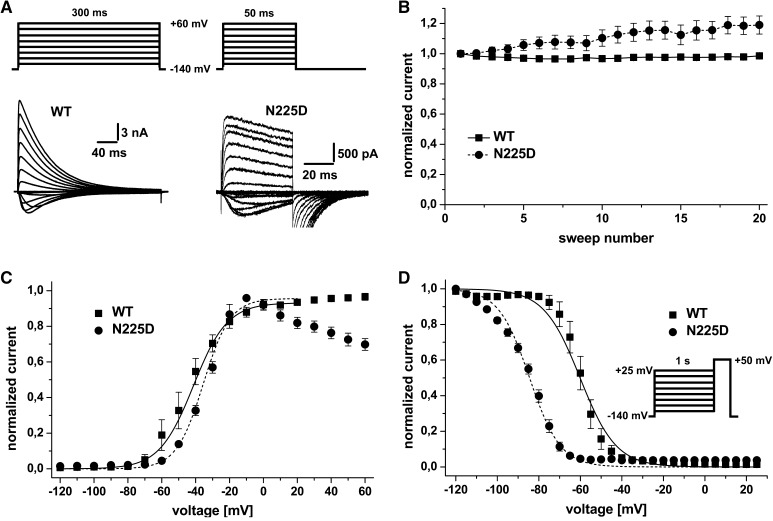
Fig. 2.
Analysis of activation and inactivation kinetics of NaChBac WT and mutant. a Representative current traces (lower panel) for activation of NaChBac-WT (left) and N225D mutant (right) expressed in HEK293t cells in response to the voltage protocol shown (top panel). Pulses for eliciting currents of N225D were shorter in order to prevent rundown. b Normalized current evoked by a series of test pulses to +50 mV at 40-s intervals for NaChBac-WT (300-ms test pulse length, squares, n = 7) and N225D mutant (50-ms test pulse length, circles, n = 10). No apparent run down is obvious. c Conductance-voltage relation of NaChBac-WT (squares) and N225D mutant (circles). The conductance was calculated from peak currents evoked by the protocol shown in a, normalized and plotted against the test pulse voltage. Data were fitted to a Boltzmann equation (solid line for WT, dotted line for N225D). d Voltage-dependence of steady-state inactivation of NaChBac-WT (squares) and N225D mutant (circles). Values were obtained by a test pulse to +50 mV following a conditioning prepulse incrementing in 5-mV steps (see inset). Peak currents were normalized to the peak current at the test pulse and plotted against the conditioning prepulse voltage

