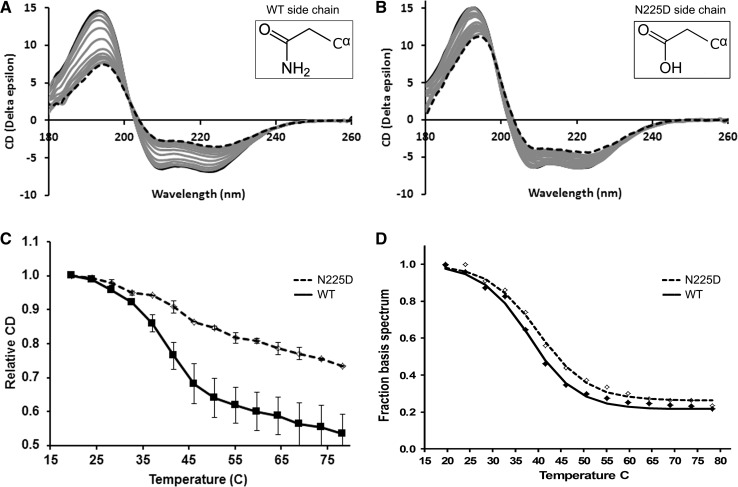
Fig. 3.
Thermal denaturation studies of NaChBac using SRCD spectroscopy. SRCD spectra of a WT and b N225D NaChBac measured over the temperature range of 20 °C (black solid lines) to 85 °C (black dotted lines) in 5 °C increments. Grey spectra are intermediate temperatures. Insets show the chemical structure of each 225 residue side chain. c Thermal denaturation curves of WT (solid line) and N225D (dashed line) derived from plotting the signals at 193 nm of spectra (a, b) versus temperature. Error bars represent 1 standard deviation between two repeats. d Fraction of first basis spectra as a function of temperature obtained by carrying out singular value deconvolution analyses (32) on the full spectra. The data are fitted to a Boltzmann function

