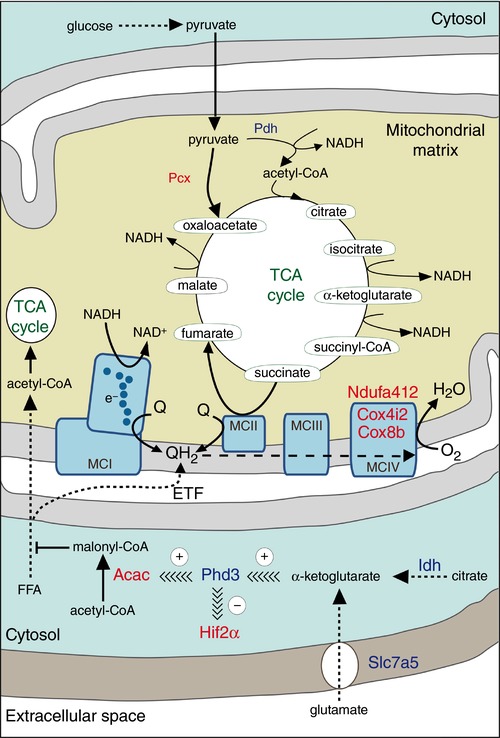
Figure 7. Model of the metabolic features of chemoreceptor glomus cells relevant to O2 sensing based on their gene expression profile.

Proteins (or subunits of an enzyme complex) highly expressed in the CB in comparison to the SCG, as suggested by the microarray analysis, are highlighted in red, whereas proteins (or subunits of an enzyme complex) with relatively low expression in the CB are represented in dark blue. Arrows attached to continuous lines indicate one‐step chemical reactions, whereas arrows attached to discontinuous lines represent multistep chemical modifications. Acac, acetyl‐coenzyme A carboxylase; Cox4i2, cytochrome c oxidase subunit IV isoform 2; Cox8b, cytochrome c oxidase subunit VIIIb; ETF, electron transport flavin/quinone oxidoreductase; FFA, free fatty acid; Hif2α, endothelial PAS domain protein 1 (Epas1); Idh, isocitrate dehydrogenase; MCI, MCII, MCIII, MCIV, mitochondrial complex I, II, III, IV, respectively; Ndufa4l2, NADH dehydrogenase (ubiquinone) 1 alpha subcomplex, 4‐like 2; Pcx, pyruvate carboxylase; Pdh, pyruvate dehydrogenase; Phd3, egl‐9 family prolyl hydroxylase 3 (Egln3); Q, ubiquinone; QH2, ubiquinol/reduced ubiquinone; Slc7a5, solute carrier family 7 (cationic amino acid transporter, y+ system), member 5; TCA, tri‐carboxylic acid. See text for detailed explanation.
