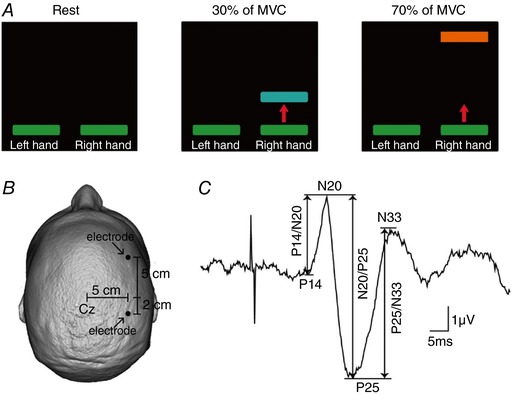
Figure 1. Experimental setup.

A, diagram showing the visual display presented to all subjects during testing of unilateral isometric index finger abduction. Subjects were instructed to remain at rest with the left hand while the right hand was at rest or performed 30% or 70% of maximal voluntary contraction (MVC) into index finger abduction. Colored bars represent the targets to which subjects needed to move a cursor. The distance between the bars represents the magnitude of force required to accomplish each task, normalized to the maximal index finger abduction determined in each subject. B, electrode positions for electroencephalographic (EEG) recordings. C, somatosensory evoked potential (SSEP) recorded over the ipsilateral (right) somatosensory cortex (iS1) following left ulnar nerve simulation for a representative subject. Waveform shows the average of 300 trials. The peak‐to‐peak amplitudes of all SSEP components (P14/N20, N20/P25 and P25/N33) were measured as shown by the arrows.
