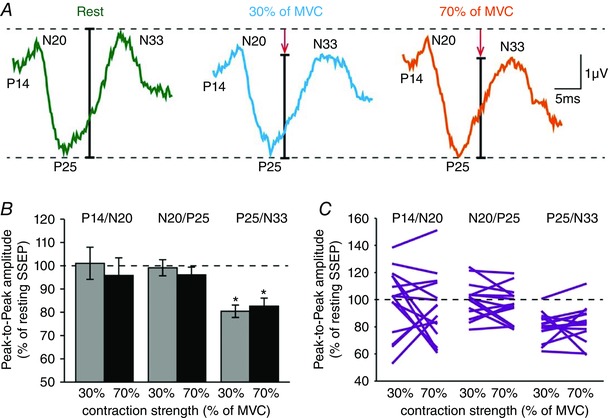
Figure 3. Somatosensory evoked potentials (SSEPs).

A, raw SSEP traces recorded from the iS1 in a representative subject when the right FDI was at rest (green) or performed 30% (blue) and 70% (orange) of MVC. Each waveform represents the average of 300 SSEPs. B, group data (n = 15) showing the amplitude of all SSEP components in the iS1 (expressed as % of resting SSEPs) during 30% (grey) and 70% (black) of MVC. The horizontal dotted line represents the amplitude of the SSEP components at rest. Data from individual subjects are also shown (C). Error bars indicate SEMs. * P < 0.05, comparison between rest and contraction.
