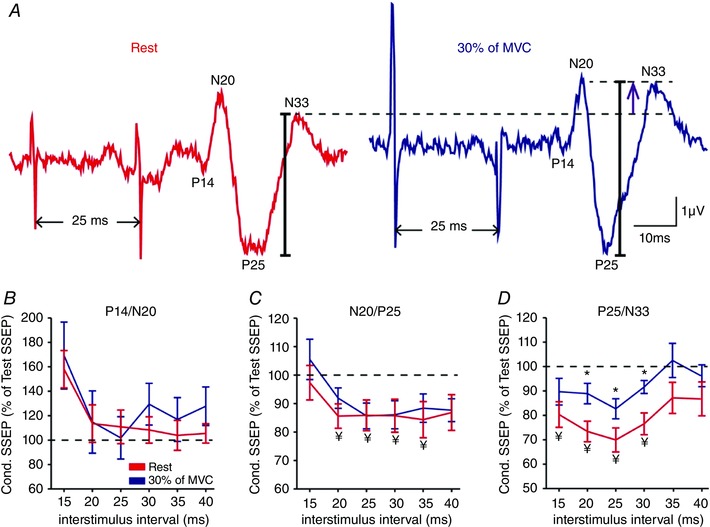
Figure 4. Paired‐pulse SSEPs between S1s.

A, raw SSEP traces showing the effect of a conditioning stimulus over the right ulnar nerve on an SSEP tested in the iS1 by stimulation of the left ulnar nerve in a representative subject at rest (red) and during 30% (blue) of MVC at an inter‐stimulus interval (ISI) of 25 ms. B–D, group data (n = 15) showing the amplitude of the conditioned SSEP expressed as % of the test SSEP at rest (red line) and during 30% (blue line) of MVC at ISIs of 15, 20, 25, 30, 35 and 40 ms for the P14/N20 (B), N20/P25 (C) and P25/N33 (D) components. The horizontal dotted line represents the amplitude of the test SSEP at rest. Note that a conditioning stimulus increased the amplitude of the P25/N33 during 30% of MVC compared with rest, suggesting that interhemispheric inhibition between S1s was decreased. * P < 0.05, comparison between rest and contraction; ¥ P < 0.05, comparison between test SSEP and conditioned SSEP at rest.
