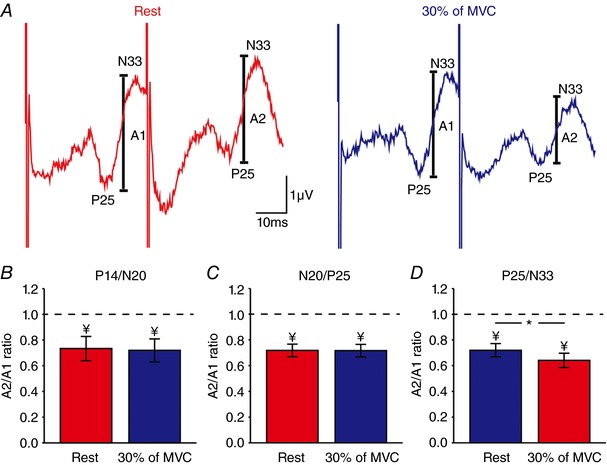
Figure 5. Paired‐pulse SSEP suppression within the iS1.

A, raw SSEP traces showing paired‐pulse SSEP suppression of the P25/N33 component in the iS1 in a representative subject at rest (red) and during 30% (blue) of MVC at an ISI of 40 ms. The amplitude of the P25/N33 component (A1 and A2, see Methods for details) is marked. Each waveform represents the average of 300 SSEPs. B–D, group data (n = 15) showing mean paired‐pulse ratios (A2/A1) at rest (red) and during 30% of MVC (blue) for the P14/N20 (B), N20/P25 (C) and P25/N33 (D) components. Note that paired‐pulse SSEP suppression of the P25/N33 but not other SSEP components was increased during 30% of MVC compared with rest, suggesting that intracortical inhibition in the iS1 was increased. * P < 0.05, comparison between rest and contraction; ¥ P < 0.05, comparison between testSSEP and conditioned SSEP at rest.
