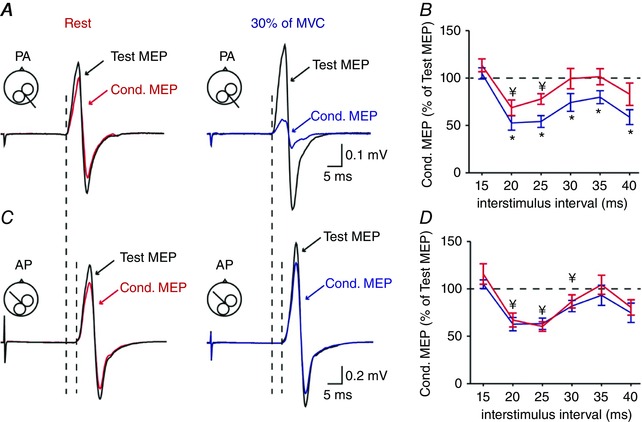
Figure 6. Short afferent inhibition (SAI) with a test MEP ∼1 mV.

A C, SAI tested with the transcranial magnetic stimulation (TMS) coil in the PA (A) and AP (C) orientation over the right ipsilateral motor cortex (M1) in a representative subject at rest (left) and during 30% of MVC (right). Test motor evoked potentials (MEPs) are indicated by black traces and arrows at rest and during 30% of MVC. Conditioned (Cond.) MEPs are indicated by red and blue traces and arrows. Traces show the average of 20 MEPs. Note that the latencies of MEPs were longer in the AP compared with the PA orientation. B and D, group data (n = 15) showing the magnitude of the conditioned MEP expressed as % of the test MEP at rest (red) and during 30% (blue) of MVC at ISIs of 15, 20, 25, 30, 35 and 40 ms for PA (B) and AP (D) MEPs. The horizontal dotted line represents the size of the test MEP. Results show that SAI tested with the coil in the PA but not AP orientation increases during voluntary activity compared with rest. * P < 0.05, comparison between the test and conditioned MEP ratio at rest and contraction; ¥ P < 0.05, comparison between test MEP and conditioned MEP at rest.
