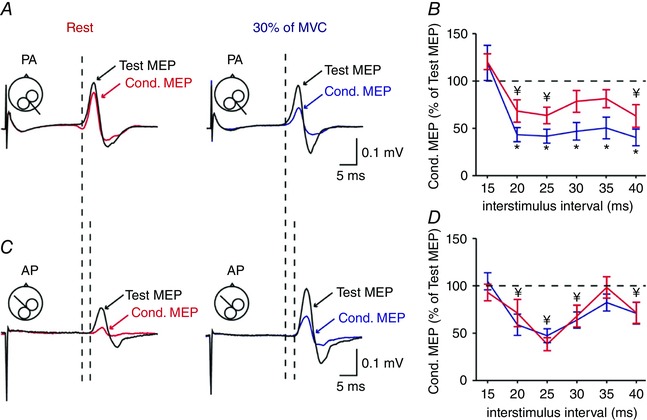
Figure 7. SAI with a test MEP ∼0.2 mV.

A and C, SAI was also tested with a test MEP of 0.2 mV with the TMS coil in the PA (A) and AP (C) orientation over the right ipsilateral M1. See data from a representative subject at rest (left) and during 30% of MVC (right). Test MEPs are indicated by black traces and arrows at rest. Conditioned (Cond.) MEPs are indicated by red and blue traces and arrows. Traces show the average of 20 MEPs. The latencies of AP MEPs were longer compared with PA MEPs. B and D, group data (n = 12) showing the magnitude of the conditioned MEP expressed as % of the test MEP at rest (red) and during 30% (blue) of MVC at ISIs of 15, 20, 25, 30, 35 and 40 ms for PA (B) and AP (D) MEPs. The horizontal dotted line represents the size of the test MEP. As for larger test MEPs, SAI tested with the coil in the PA but not AP orientation increases during voluntary activity compared with rest. * P < 0.05, comparison between the test and conditioned MEP ratio at rest and contraction; ¥ P < 0.05, comparison between test MEP and conditioned MEP at rest.
