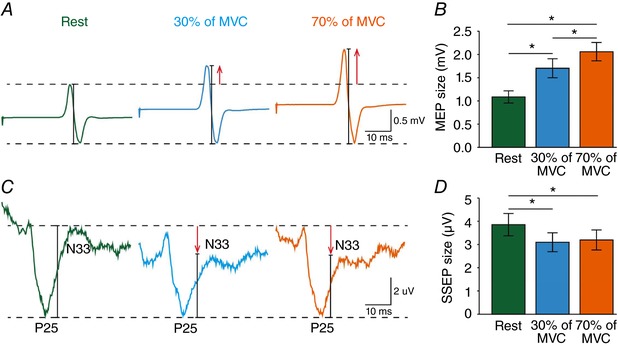
Figure 8. MEPs and SSEPs.

MEPs were also tested with the TMS coil in the PA and AP (not shown) orientation by stimulating the right ipsilateral M1 at rest (green) or at 30% (blue) and 70% (orange) of MVC. For comparisons between M1 and S1 responses during the same motor tasks, here we also added the SSEP data recorded from the iS1 in the same subjects. A and C, MEP (A) traces show the average of 20 MEPs and SSEP (C) traces show the average of 300 SSEPs. B and D, group data (n = 8) showing the magnitude of MEPs (B) and the P25/N33 SSEP component (D) across conditions (rest = green bars, 30% of MVC = blue bars, 70% of MVC = orange bars). * P < 0.05, comparison between rest and contraction.
