
Fig. 6.
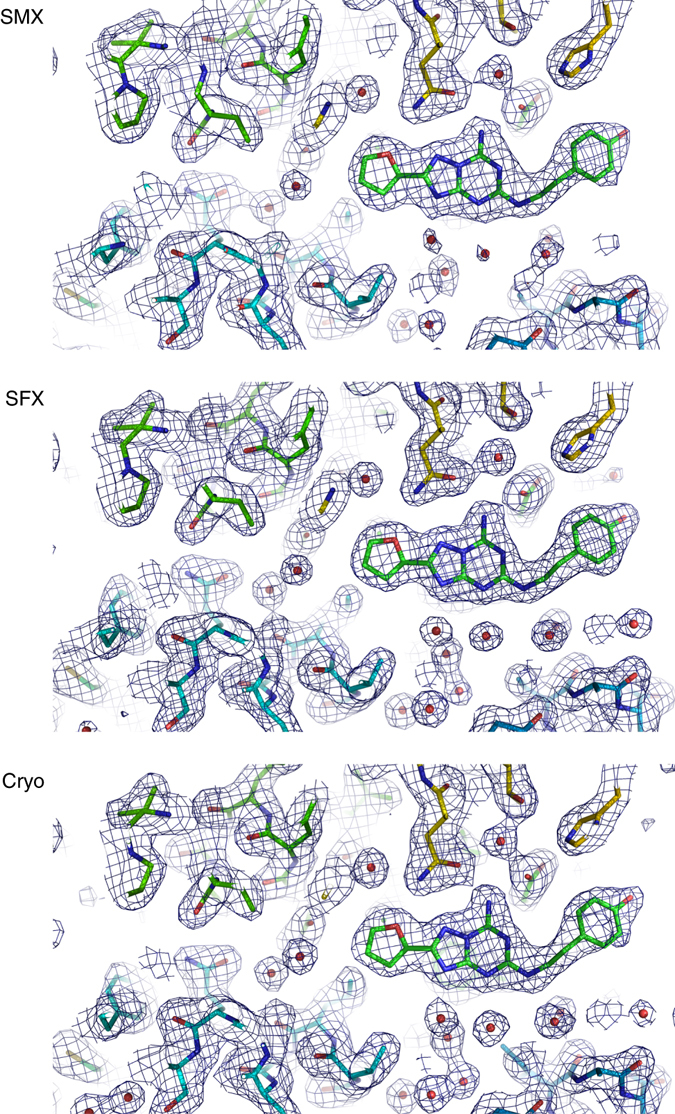
Comparison of the A2A receptor electron density obtained using SMX, SFX and conventional cryo-crystallographic data. The structures show the ligand binding pocket with 2Fo–Fc maps shown at 1σ. All data sets were collected using A2AR crystals prepared in the same way to facilitate a direct comparison of the techniques. The SMX density is well defined, but the overall resolution (2.1 Å) is lower than in SFX (1.7 Å) and cryo-crystallography (1.95 Å)