Figure 2.
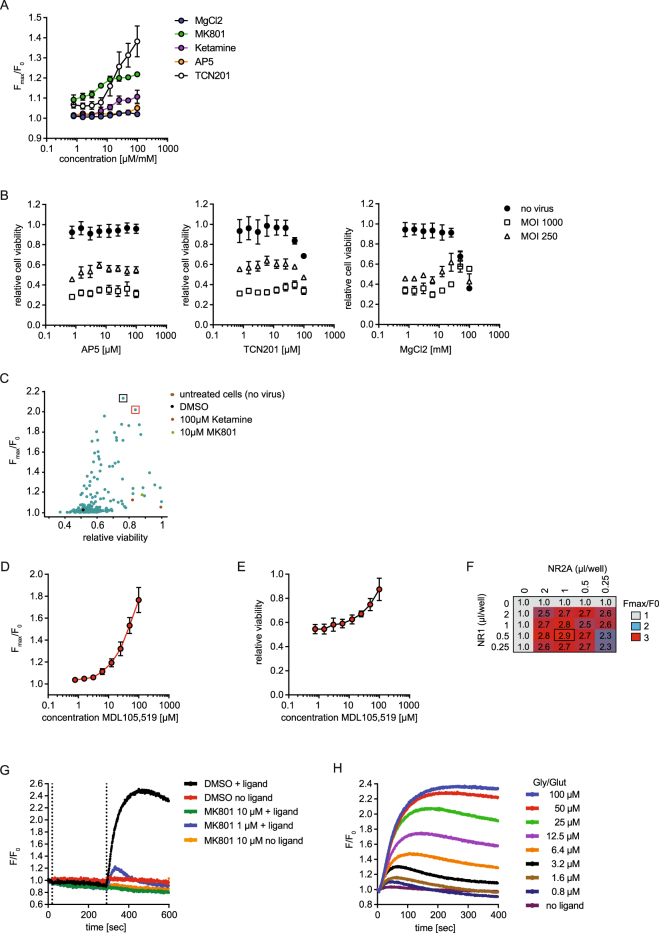
Protection of NMDAR-expressing cells with MDL105,519, but not MK801 or Ketamine, facilitates NMDAR-activity in functional assay. (A) NMDAR-mediated calcium flux in HEK293 cells transduced with baculovirus. NR1/2A-transduced HEK293 cells were treated with the indicated compounds. 16 h later, cells were washed three times, loaded with Calcium6 dye and NMDAR-mediated calcium flux was measured after stimulation with 100 µM glycine/glutamate. Data represents the mean ± SEM of the maximal fluorescence ratio (maximal fluorescence/baseline fluorescence, Fmax/F0) of three experiments. Units for x-axes are mM for MgCl2 and µM for all other inhibitors. The raw traces for a representative experiment are shown in Supplementary Figure 1. (B) Cell viability of NR1/2A-transduced cells with concurrent treatment with the indicated NMDAR-inhibitors was measured 16 h after infection using CellTiterGlo. Data was normalized to non-transduced cells in the presence of DMSO and represents the mean ± SEM of three experiments. (C) Identification of NMDAR protective compounds. Cells were transduced with baculovirus encoding NR1/NR2A with concurrent treatment with ~120 NMDAR-inhibitors (3 µM or 100 µM), and analyzed as in (A and B). Data represents the mean of two replicates and was normalized to DMSO cells (no virus). The black and red box highlights the two best screening hits: 100 µM MDL105,519 and 3 µM CGP070667, respectively. (D) NMDAR-mediated calcium flux in presence of MDL105,519. Cells were prepared as in (A) and treated with different concentrations of MDL105,519. Data represents the maximal fluorescence ratio, ± SEM, four experiments. (E) Cell viability of NMDAR-expressing cells in presence of MDL105,519. Cells were prepared as in (D) and analyzed as in. (B) Data represents the mean ± SEM of four experiments. (F) Titration of the maximal NMDAR-mediated calcium flux in HEK293 cells transduced with baculovirus. Cells were prepared and analyzed as in (D). Data represents the mean of the maximal fluorescence ratio of three independent wells. (G) Test for ligand-independent activity of NMDAR. Cells were prepared as in (D). MK801 or DMSO was added and NMDAR-mediated calcium flux was measured for 5 min before and after addition of 100 µM glutamate/glycine. Data represent the fluorescence ratio shown as raw data of representative wells. (H) Ligand concentration dependency of NMDAR-mediated calcium flux. Cells were prepared as in (D). Data represent the fluorescence ratio shown as raw traces of representative wells.

