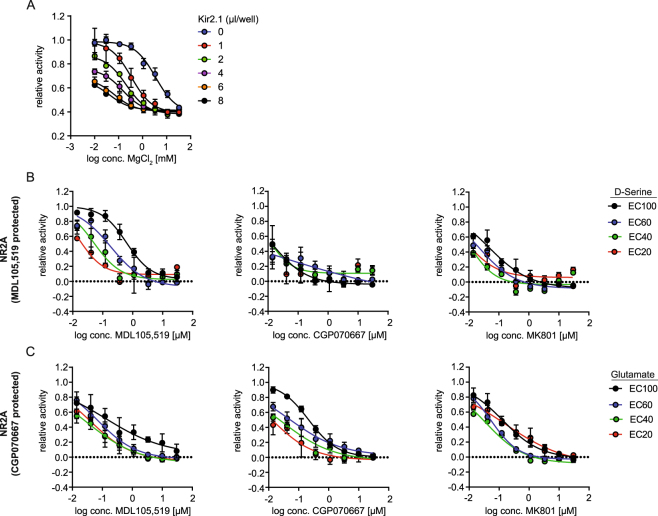
Figure 4.
Characterization of the mode of action of NMDAR inhibitors. (A) Sensitivity of NMDAR-mediated calcium flux to inhibition by magnesium at varying membrane potentials. HEK293 cells were transduced with baculovirus encoding KCNJ2 (Kir2.1), NR1 and NR2A in the presence of MDL105,519 and NMDAR-mediated calcium flux was measured as previously described in the presence of varying amounts of magnesium chloride. The maximal fluorescence ratio was normalized to NR1/2A-transduced cells in the absence of magnesium. Data represents the mean ± SEM of three experiments. (B,C) Sensitivity of NR1/2 A mediated calcium flux to inhibition by MDL105,519 (first column), CGP070667 (middle column) or MK801 (last column) at different ligand concentrations. HEK293 cells were transduced with baculovirus encoding NR1 and NR2A in the presence of MDL105,519 (B) or CGP070667 (C) and NMDAR-mediated calcium flux was measured as described in the presence of the indicated ligand concentrations. The integral of the maximal fluorescence ratio was normalized to the activity measured in the absence of inhibitor (DMSO only) at the respective ligand concentration. Data represents the mean ± SEM of three experiments.

