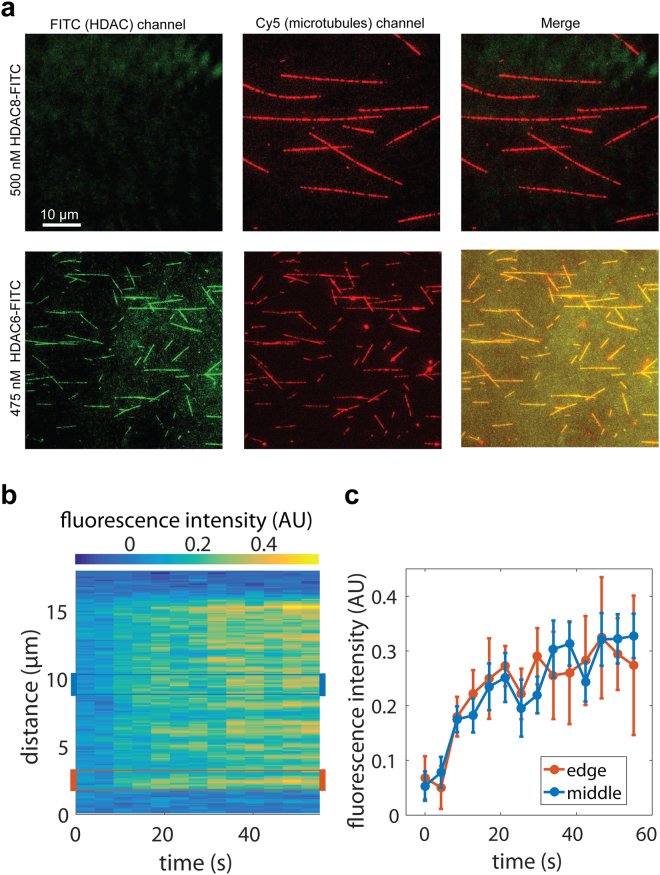
Figure 4.
Interaction of HDAC6 with microtubules visualized by TIRF microscopy. (a) HDAC6 interacts directly with microtubules. Cy5-labeled microtubules were immobilized on a glass coverslip surface. Micrographs show microtubules (red) in the presence of 500 nM HDAC8-FITC (green; negative control, upper panel) or 475 nM FITC-labeled HDAC6 (green; lower panel). In the presence of FITC-labeled HDAC6, fluorescent signals of microtubules and HDAC6 co-localize along the whole length of microtubules (yellow). (b,c) HDAC6-GFP binds uniformly along the whole length of the microtubules. GFP-HDAC6 fusion was added to surface-immobilized microtubules and visualized in the 488 channel using TIRF microscopy. Uniform increase in GFP fluorescence intensity was observed along the whole length of microtubules. The kymograph in Panel B depicts averaged (background subtracted) GFP fluorescence intensity of 4 microtubules of the same length (approximately 12 µm) after the addition of HDAC6-GFP in the timespan from 0 to 60 seconds. The right panel shows the averaged GFP signal (±s.d.) over time at the edge of the microtubules (orange line) and in the middle (blue line). The regions (width of 1.5 µm) used for the averaging are indicated in the kymograph (b) by orange and blue rectangles.

