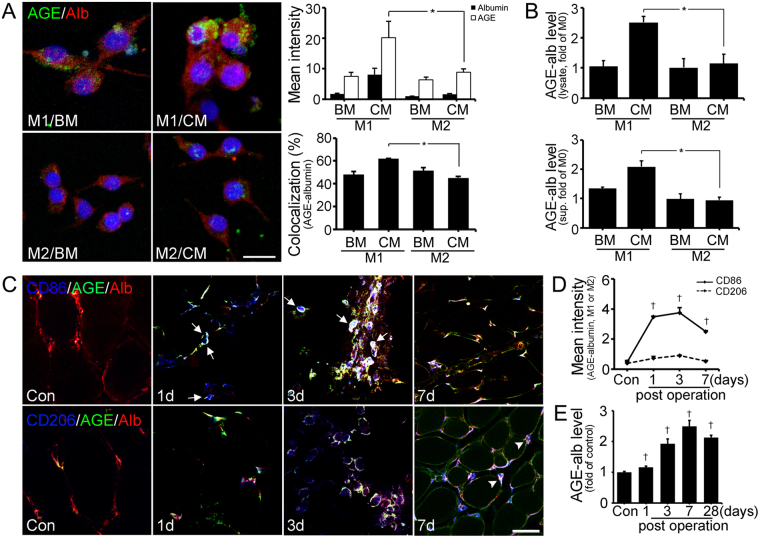
Figure 2.
Expression of AGE-albumin in M1/M2 macrophage cells and animal model. (A) Triple-labeled confocal microscopic images shows relative levels of AGEs (green), albumin (red), and DAPI (blue) in M1 or M2 cells with basal media (BM) or conditioned media (CM) treatment. Scale bar = 20 μm (B) The amounts of intracellular (cell lysate) and extracellular (supernatant) AGE-albumin of macrophage cells were determined by ELISA. (C) Triple-labeled confocal microscopic images of AGEs (green) and albumin (red) with activated macrophage markers (blue) were taken. Arrows indicate AGE-albumin positive labeling of macrophages and AGE-albumin is shown in arrowhead. (D,E) The AGE-albumin positive labeling of macrophages (white) was determined by Zen 2009 software (Zeiss) and the AGE-albumin level of PIRI-CLI damaged skeletal muscle was also detected until 4 weeks. Scale bar = 50 μm. mean ± s.d. (*P < 0.05) and (†P < 0.01) vs. Con.

