Figure 3.
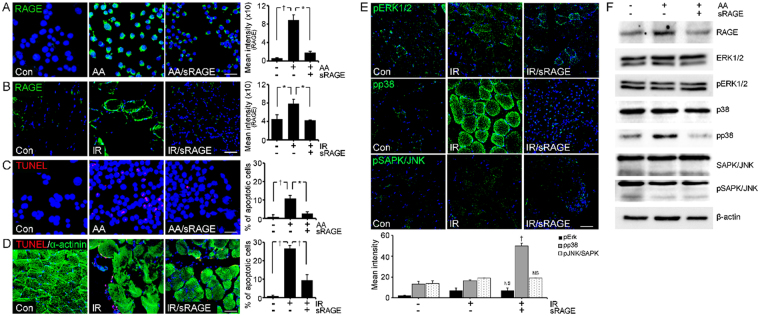
RAGE expression and its inhibition by sRAGE through MAPK pathway. (A,B) Relative levels of RAGE (green) were determined by immunohistochemistry analysis. The levels of RAGE in L6 cells after AGE-albumin (AA), AA with sRAGE treatment (AA/sRAGE) and in PIRI-CLI (IR) without or with sRAGE treatment. (C,D) Apoptotic L6 cells (red) and skeletal muscles of PIRI-CLI mice (red) with skeletal muscle cell marker (α-actinin, green) were analyzed by TUNEL labeling. (E,F) Level of MAPK intensity was determined in mice muscle by immunohistochemistry and Immunoblotting. Scale bar = 50 μm. mean ± s.d. (*P < 0.05) and (†P < 0.01).

