
Fig. 4.
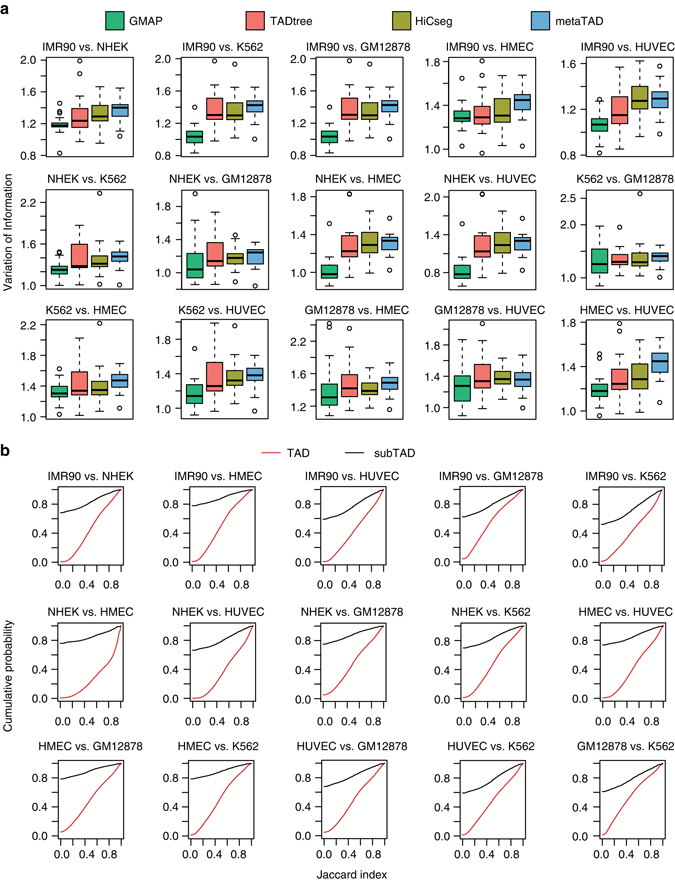
SubTAD boundaries are more dynamic than TAD boundaries across different cell lines. a Pairwise similarity of TADs across six human cell lines, GM12878, HMEC, HUVEC, IMR90, K562, NHEK. In all but four pairwise comparisons, the difference between GMAP and the other three methods is significantly different based on t-test (P < 0.05). The whiskers represent the most extreme data point which is no more than 1.5 times the interquartile range. b Comparison of pairwise similarities for TADs and subTADs across six human cell lines. The cumulative probability plots show that subTAD boundaries are more dynamic across all pairwise comparisons of the six cell lines. In all pairwise comparisons, the cumulative distribution for subTADs is significantly different than the distribution for TADs based on KS test (P < 0.05)