Fig. 2.

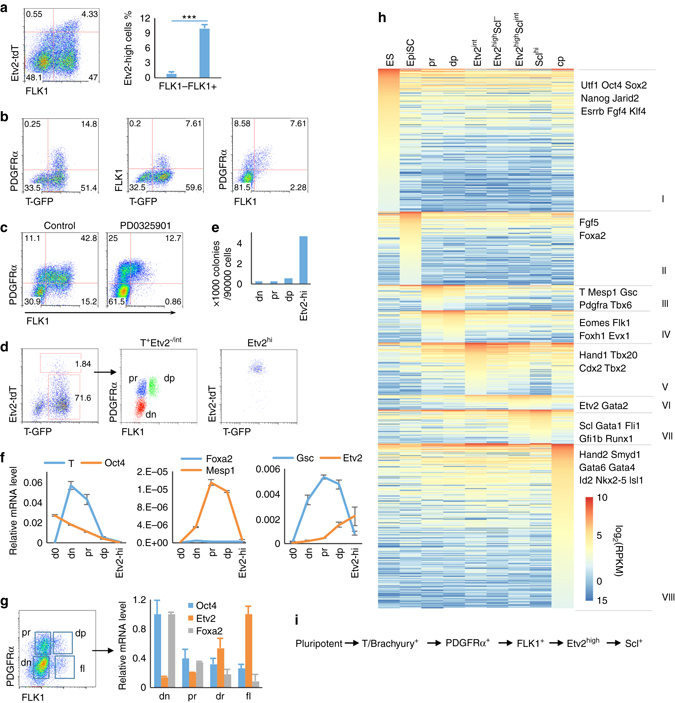
Developmental route of Etv2hi hemangiogenic progenitors. a FACS plot of Etv2-tdTomato and FLK1 in D4 SGET EBs is shown on the left. The percentage of Etv2high cells within FLK1-negative or -positive cells is shown on the right. ***P value <0.001 in Student’s t test, n = 3. Error bars are s.d. b Coexpression patterns of PDGFRα vs. T-GFP, FLK1 vs. T-GFP, and PDGFRα vs. FLK1, in D2.5 TGET EBs. c D3.5 SGET EBs treated with DMSO (control) or ERK inhibitor PD0325901 (2 μM) were analyzed for PDGFRα and FLK1 expression by flow cytometry. PD0325901 was added from D2.5 to 3.5. d FACS sorting scheme of various mesodermal cell populations from D3.5 TGET EB is shown. T-GFP+PDGFRα-FLK1− (dn), T-GFP+PDGFRα+FLK1− (pr), and PDGFRα+FLK1+ (dp). e Blast colony number obtained from various cell populations as sorted in d is shown. f Marker gene expression pattern in the sorted populations as in d is shown. D0 indicates undifferentiated ES cells. g Indicated populations were sorted from E7.5 embryos and analyzed for relative mRNA levels. h Comparative transcriptome analysis for indicated cell populations is shown. Three thousand eight hundred fifteen genes that are expressed in at least one sample and have a minimal RPKM change of 5-fold among the samples were chosen for comparison. ES undifferentiated mouse embryonic stem cells, EpiSC ES cell-derived epiblast stem cells, “pr” and “dp” were already described in d; Etv2int, Etv2hiScl−, Etv2hiSclint, and Sclhi cells were described in Fig. 1e; “cp”, ES cell-derived cardiac progenitors25. The D6 endoderm sample is not shown in the plot, but is included in the differential expression analysis and Supplementary Data 2. i Schematic diagram shows a developmental route of ES cells to the Etv2-tdTomatohi(gh)/Scl-GFP+ hemangiogenic state
