Fig. 4.
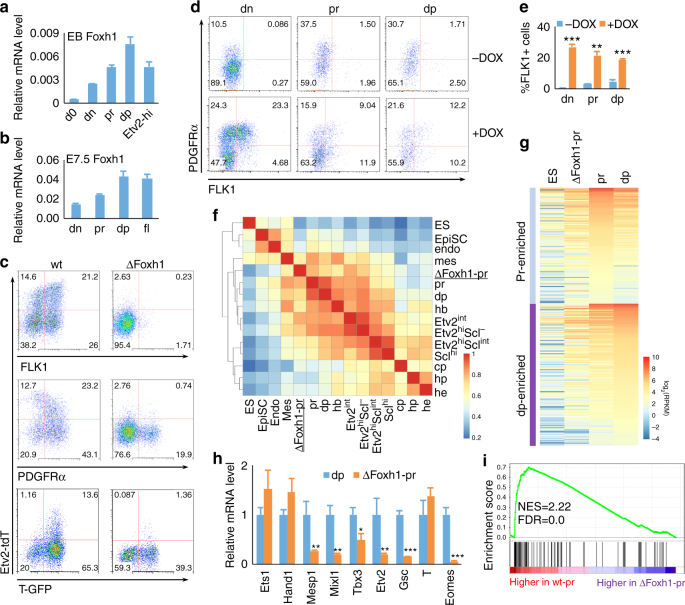
Foxh1 is required for FLK1+ mesoderm generation. a Relative mRNA levels of Foxh1 in indicated cell populations sorted from D4 EBs are shown. b Relative mRNA levels of Foxh1 in indicated cell populations sorted from E7.5 embryos are shown. c FACS analysis of D4 wild type (wt) and ΔFoxh1 EB cells is shown. (Top and middle, SGET cells; bottom, TGET cells). d iFoxh1-ΔFoxh1 cells were differentiated with 500 ng/mL DOX, “dn”, “pr” and “dp” cells were sorted on D3, and re-seeded onto OP9 cells with or without 500 ng/mL of DOX. Cells were analyzed 24 h later by flow cytometry. The results are summarized in e. f Spearman correlation map of RNA-seq data of transcription-related factors from indicated populations. g Comparison of RNA-seq results of “pr-” or “dp”-enriched genes in ΔFoxh1 “pr”, wt “pr”, “dp”, and undifferentiated ES cells is shown. h Expression of key transcription factors with highest expression in “dp” (identified in Fig. 2g) was validated by qRT-PCR using ΔFoxh1 “pr” and wt “dp” cells. i GSEA analysis of T-related genes41 for downregulation in ΔFoxh1-pr vs. wt-pr cells. Only genes related to T with correlation scores >0.2 were chosen for GSEA analysis. NES normalized enrichment score, FDR false discovery rate. *P value <0.05 in Student’s t test, **P < 0.01, ***P < 0.001, and n = 3. Error bars are s.d

